What would best predict shipping costs?
Units shipped?
Weight shipped?
Sales value of units shipped?
The following data represents information relating to shipments made.
Month Units Shipped Weight Shipped Sales Value Shipping Costs
May 10,000 7,500 350,000 38,000
June 12,000 8,760 432,000 42,000
July 15,000 9,200 420,000 50,100
August 20,000 10,500 400,000 72,500
September 12,000 7,600 300,000 41,000
October 8,000 6,000 320,000 35,600
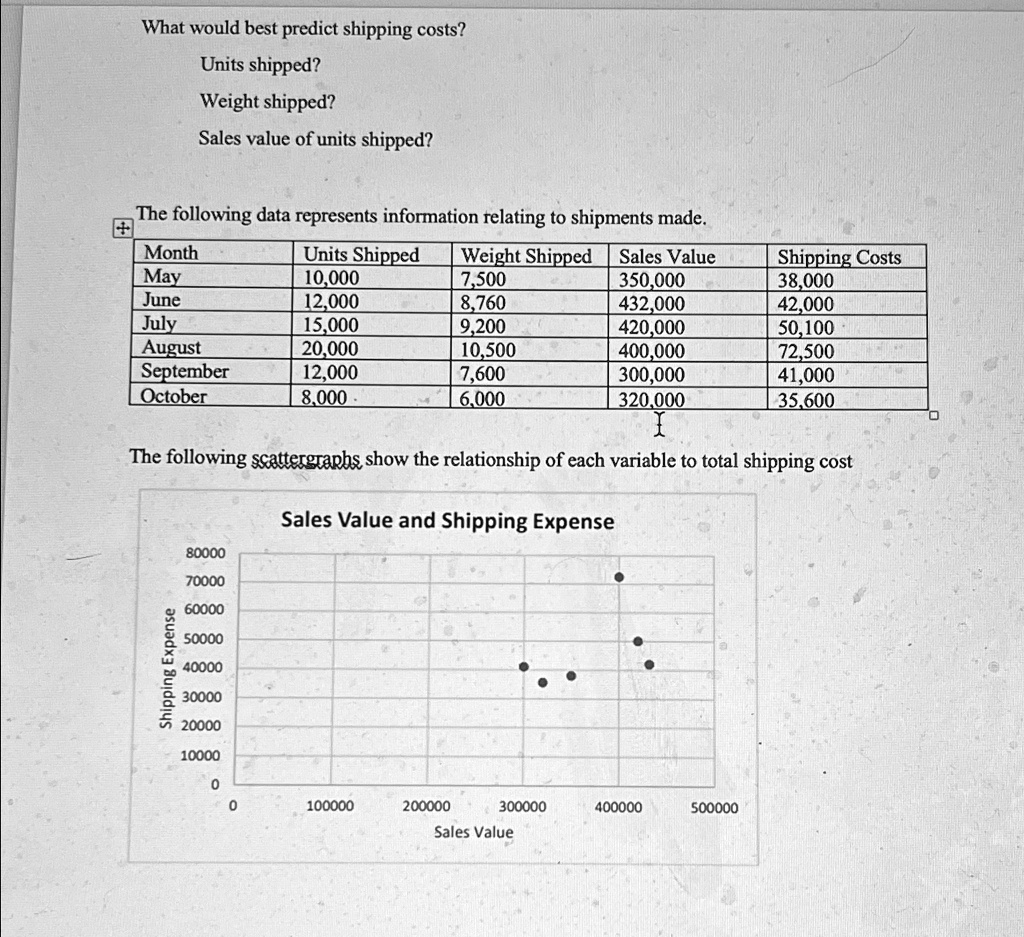
The following scattergraphs show the relationship of each variable to total shipping cost
Sales Value and Shipping Expense