You may not ask for help from others or give help to others on specif project questions. The table below shows the results of the new test in a population that has a different disease prevalence. (e) Has Disease (Infected) {:[" Does Not Have Disease "],[" (Healthy) "]:} Totals Positive {:[" True Positive "],[3","749]:} {:[" False Positive "],[2","307]:} 6,056 Negative {:[" False Negative "],[116]:} {:[" True Negative "],[43","828]:} 43,944 Totals 3,865 46,135 50,000 Answer as a percentage rounded to two decimal places. Show your calculations. 13. What is the probability that someone in this population has the disease? This is the prevalence of the (4 pts) 13. What is the probability that O J. Schlaak, N. Wahle 2021 - This
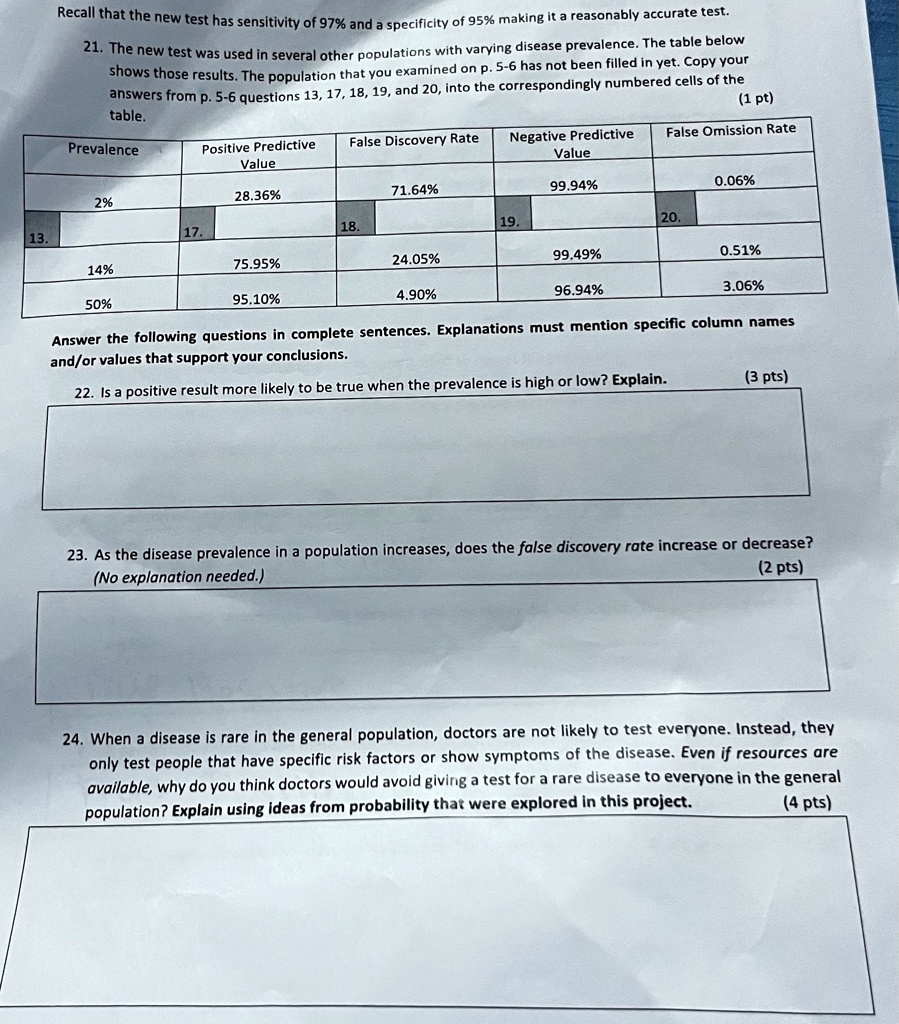
1pt
table.
False Discovery Rate
Negative Predictive Value
False Omission Rate
Prevalence
Positive Predictive Value
71.64%
99.94%
0.06%
2%
28.36%
18.
19
20
13.
17.
99.49%
0.51%
75.95%
24.05%
14%
4.90%
96.94%
3.06%
50%
95.10%
Answer the following questions in complete sentences. Explanations must mention specific column names and/or values that support your conclusions. 22.Is a positive result more likely to be true when the prevalence is high or low? Explain. (3 pts)
23. As the disease prevalence in a population increases, does the false discovery rate increase or decrease? (No explanation needed.) (2pts)
24. When a disease is rare in the general population, doctors are not likely to test everyone. Instead, they only test people that have specific risk factors or show symptoms of the disease. Even if resources are available, why do you think doctors would avoid giving a test for a rare disease to everyone in the general population? Explain using ideas from probability that were explored in this project. (4 pts)