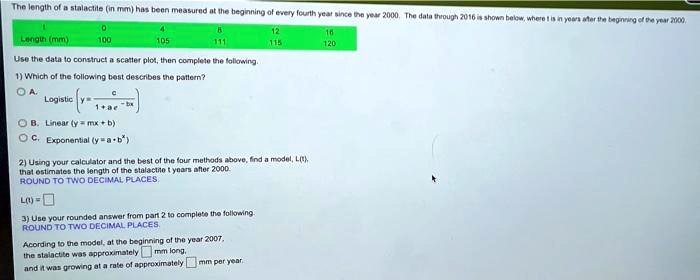
The length of a stalactite (in mm) has been measured at the beginning of every fourth year since the year 2000. The data through 2016 is shown below, where t is in years after the beginning of the year 2000.
Length (mm)
0
100
4
105
8
111
12
115
16
120
Use the data to construct a scatter plot, then complete the following.
1) Which of the following best describes the pattern?
A. Logistic $y = \frac{c}{1 + ae^{-bx}}$
B. Linear ($y = mx + b$)
C. Exponential ($y = a \cdot b^x$)
2) Using your calculator and the best of the four methods above, find a model, L(t),
that estimates the length of the stalactite t years after 2000.
ROUND TO TWO DECIMAL PLACES
L(t) =
3) Use your rounded answer from part 2 to complete the following.
ROUND TO TWO DECIMAL PLACES.
Acording to the model, at the beginning of the year 2007,
the stalactite was approximately mm long,
and it was growing at a rate of approximately mm per year.