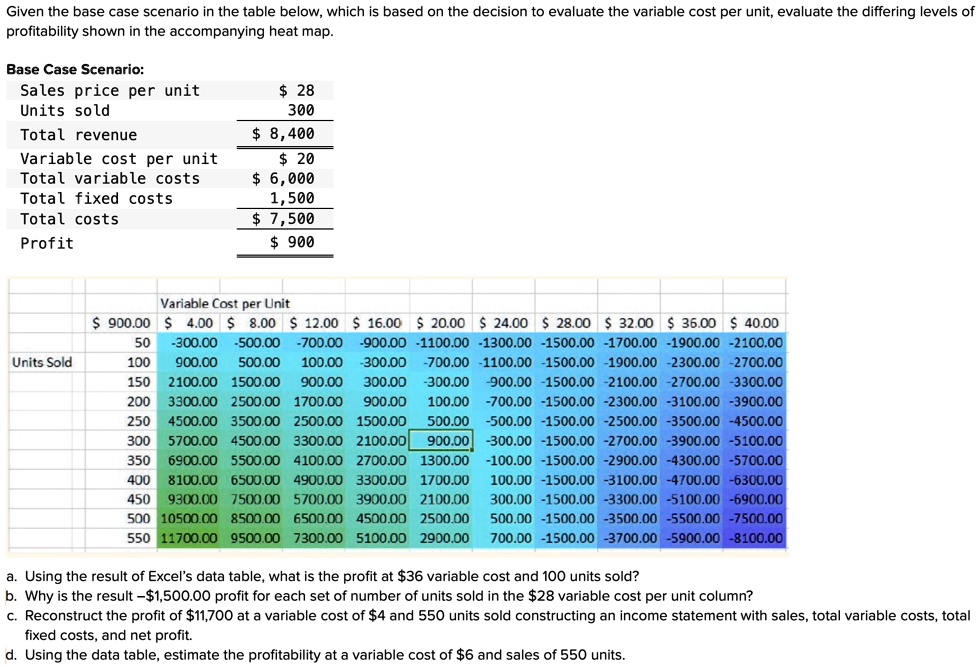
Base Case Scenario:
Sales price per unit $ 28
Units sold 300
Total revenue $ 8,400
Variable cost per unit $ 20
Total variable costs $ 6,000
Total fixed costs $ 1,500
Total costs $ 7,500
Profit $ 900
Variable Cost per Unit
Units Sold $ 900.00 $ 4.00 $ 8.00 $ 12.00 $ 16.00 $ 20.00 $ 24.00 $ 28.00 $ 32.00 $ 36.00 $ 40.00
50 -300.00 -500.00 -700.00 -900.00 -1100.00 -1300.00 -1500.00 -1700.00 -1900.00 -2100.00
100 900.00 500.00 100.00 -300.00 -700.00 -1100.00 -1500.00 -1900.00 -2300.00 -2700.00
150 2100.00 1500.00 900.00 300.00 -300.00 -900.00 -1500.00 -2100.00 -2700.00 -3300.00
200 3300.00 2500.00 1700.00 900.00 100.00 -700.00 -1500.00 -2300.00 -3100.00 -3900.00
250 4500.00 3500.00 2500.00 1500.00 500.00 -300.00 -1500.00 -2500.00 -3500.00 -4500.00
300 5700.00 4500.00 3300.00 2100.00 900.00 -500.00 -1500.00 -2700.00 -3900.00 -5100.00
350 6900.00 5500.00 4100.00 2700.00 1300.00 -100.00 -1500.00 -2900.00 -4300.00 -5700.00
400 8100.00 6500.00 4900.00 3300.00 1700.00 100.00 -1500.00 -3100.00 -4700.00 -6300.00
450 9300.00 7500.00 5700.00 3900.00 2100.00 300.00 -1500.00 -3300.00 -5100.00 -6900.00
500 10500.00 8500.00 6500.00 4500.00 2500.00 500.00 -1500.00 -3500.00 -5500.00 -7500.00
550 11700.00 9500.00 7300.00 5100.00 2900.00 700.00 -1500.00 -3700.00 -5900.00 -8100.00
a. Using the result of Excel's data table, what is the profit at $36 variable cost and 100 units sold?
b. Why is the result -$1,500.00 profit for each set of number of units sold in the $28 variable cost per unit column?
c. Reconstruct the profit of $11,700 at a variable cost of $4 and 550 units sold constructing an income statement with sales, total variable costs, total
fixed costs, and net profit.
d. Using the data table, estimate the profitability at a variable cost of $6 and sales of 550 units.