11. The Laffer curve
Government-imposed taxes cause reductions in the activity that is being taxed, which has important implications for revenue collections.
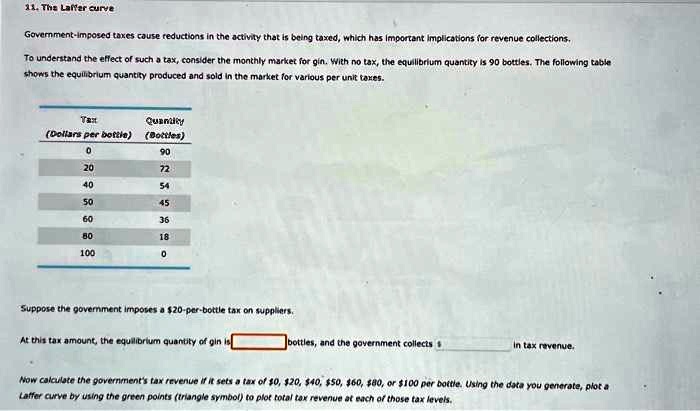
To understand the effect of such a tax, consider the monthly market for gin. With no tax, the equilibrium quantity is 90 bottles. The following table
shows the equilibrium quantity produced and sold in the market for various per unit taxes.
Tax
Quantity
(Dollars per bottle)
(Bottles)
0
90
20
72
40
54
50
45
60
36
80
18
100
0
Suppose the government imposes a $20-per-bottle tax on suppliers.
At this tax amount, the equilibrium quantity of gin is
bottles, and the government collects $
in tax revenue.
Now calculate the government's tax revenue if it sets a tax of $0, $20, $40, $50, $60, $80, or $100 per bottle. Using the data you generate, plot a
Laffer curve by using the green points (triangle symbol) to plot total tax revenue at each of those tax levels.