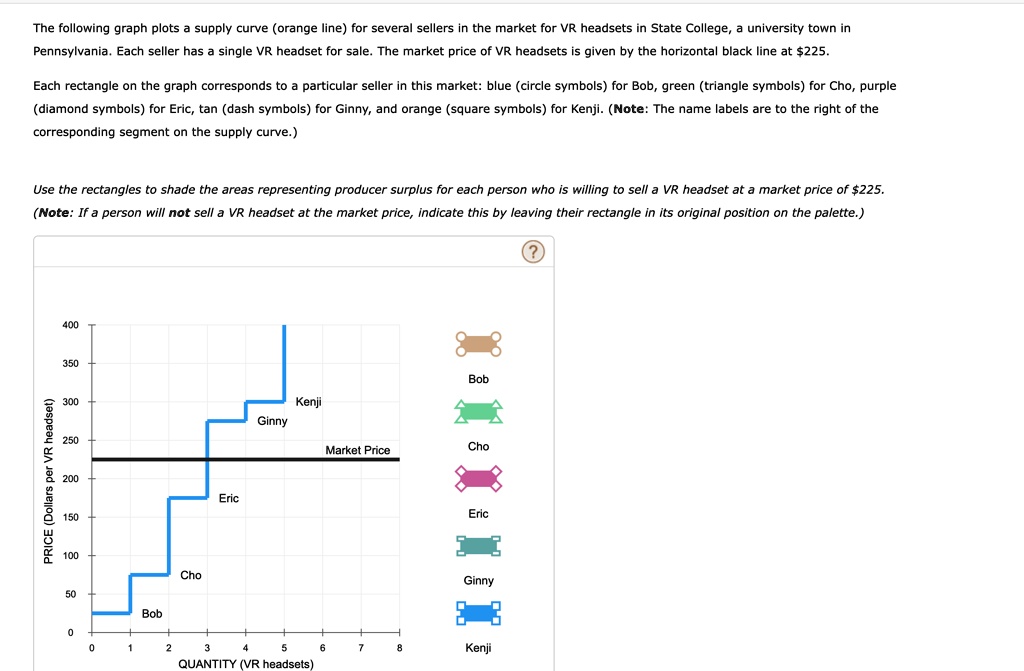
The following graph plots a supply curve (orange line) for several sellers in the market for VR headsets in State College, a university town in Pennsylvania. Each seller has a single VR headset for sale. The market price of VR headsets is given by the horizontal black line at $225.
Each rectangle on the graph corresponds to a particular seller in this market: blue (circle symbols) for Bob, green (triangle symbols) for Cho, purple (diamond symbols) for Eric, tan (dash symbols) for Ginny, and orange (square symbols) for Kenji. (Note: The name labels are to the right of the corresponding segment on the supply curve.)
Use the rectangles to shade the areas representing producer surplus for each person who is willing to sell a VR headset at a market price of $225.
(Note: If a person will not sell a VR headset at the market price, indicate this by leaving their rectangle in its original position on the palette.)
400
350
300
Kenji
Ginny
PRICE (Dollars per VR headset)
250
200
Market Price
Eric
150
100
50
Bob
Cho
0
1
2
3
4
5
6
7
8
QUANTITY (VR headsets)
Bob
Cho
Eric
Ginny
Kenji