equation of the graph, explain why this shape agrees or disagrees with Hooke's Law.
PART II
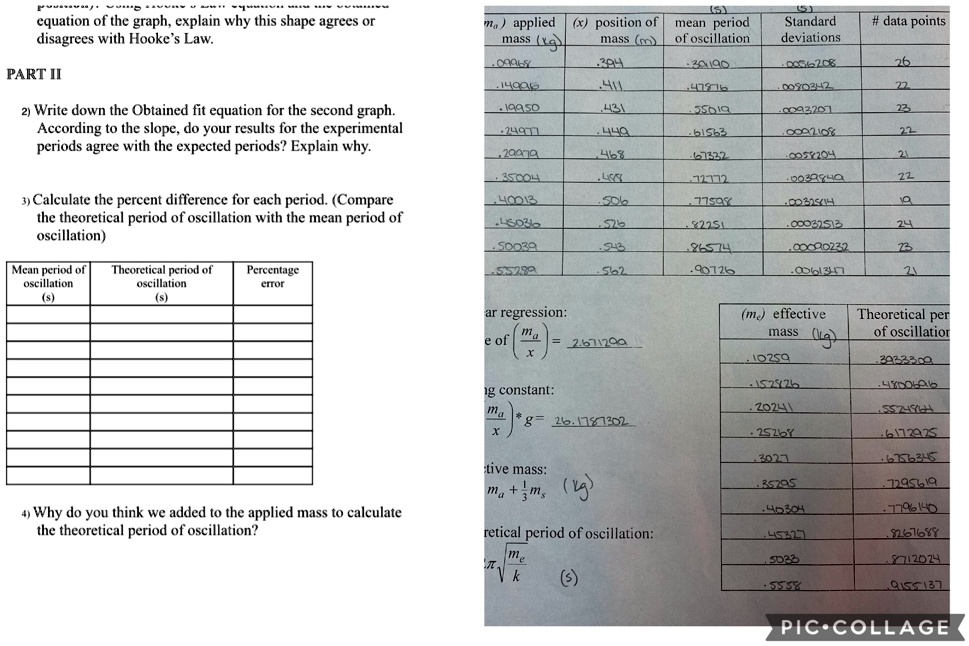
Write down the Obtained fit equation for the second graph. According to the slope, do your results for the experimental periods agree with the expected periods? Explain why.
Calculate the percent difference for each period. (Compare the theoretical period of oscillation with the mean period of oscillation)
Mean period of oscillation (s)
equation of the graph, explain why this shape agrees or disagrees with Hooke's Law
5
ma) applied x position of mean period mass(x mass(m) of oscillation 304 39190 140Q6 TH 9LSLH 199,50 431 55010
Standard deviations
# data points
0056208
26
PART II
00903H2
22
2 Write down the Obtained fit equation for the second graph. According to the slope, do your results for the experimental periods agree with the expected periods? Explain why
0093201
23 22
.249 .20079
449
61563
0092108
46% LISY
67332
FOZXSCO
21
35004
12772
22
3Calculate the percent difference for each period. Compare the theoretical period of oscillation with the mean period of oscillation)
40013 .45030 .50039
50o
0032S/14
576 S43
2251
00037513
24 23 21
.96574
.00090232 06134
Mean period of oscillation (s)
Theoretical period of oscillation (s)
Percentage error
55280
502
.90726
ar regression: ma of 2.671200 x
(meffective mass (ra .10259
Theoretical per of oscillation
3933300
g constant: ma g=26.1781302
152526
20241
2526Y
6172925
3027
6756345
tive mass: ma+!ms
35295
7295619
4 Why do you think we added to the applied mass to calculate the theoretical period of oscillation?
.40304
CHoLL
retical period of oscillation: me (s)
LLESH
826768Y
5033
9712024
55S%
Q55137
PICCOLLAGE