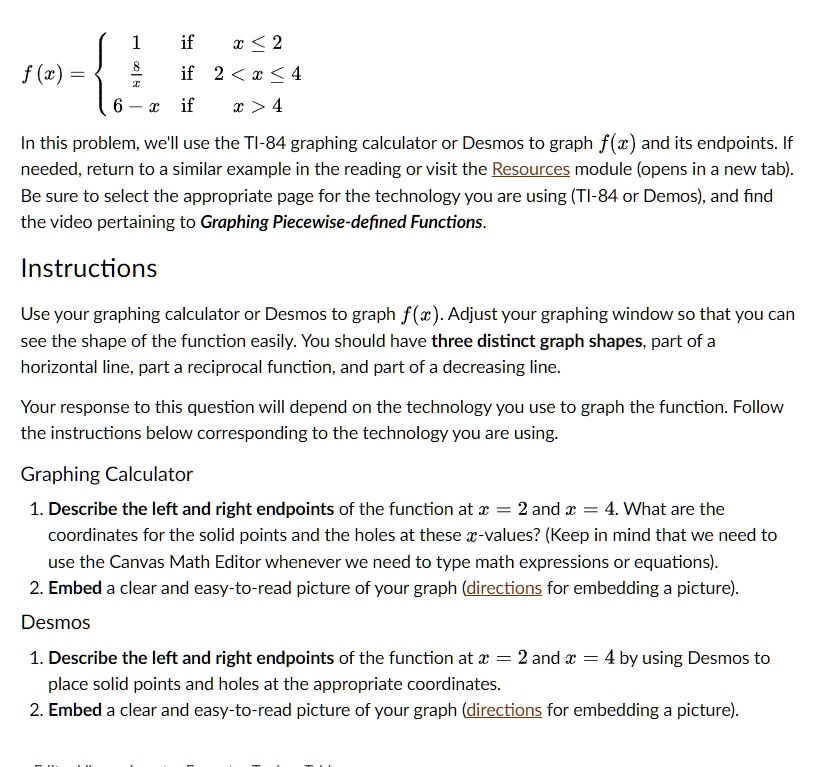
Texts: 1 8
If
x < 2
f(x)
2 < x < 4
6 - if
x > 4
In this problem, we'll use the TI-84 graphing calculator or Desmos to graph f() and its endpoints. If needed, return to a similar example in the reading or visit the Resources module (opens in a new tab). Be sure to select the appropriate page for the technology you are using (TI-84 or Desmos), and find the video pertaining to Graphing Piecewise-defined Functions.
Instructions:
Use your graphing calculator or Desmos to graph f(). Adjust your graphing window so that you can see the shape of the function easily. You should have three distinct graph shapes: part of a horizontal line, part of a reciprocal function, and part of a decreasing line.
Your response to this question will depend on the technology you use to graph the function. Follow the instructions below corresponding to the technology you are using.
Graphing Calculator:
1. Describe the left and right endpoints of the function at x = 2 and x = 4. What are the coordinates for the solid points and the holes at these x-values? (Keep in mind that we need to use the Canvas Math Editor whenever we need to type math expressions or equations.)
2. Embed a clear and easy-to-read picture of your graph (directions for embedding a picture).
Desmos:
1. Describe the left and right endpoints of the function at x = 2 and x = 4 by using Desmos to place solid points and holes at the appropriate coordinates.
2. Embed a clear and easy-to-read picture of your graph (directions for embedding a picture).