100 Demand
80
70
PRICE (Dollars per small truck)
60
50
40
30
20
10
0
0
1
2
3
4
Supply
5
6
7
8
9
10
QUANTITY (Hundreds of small trucks)
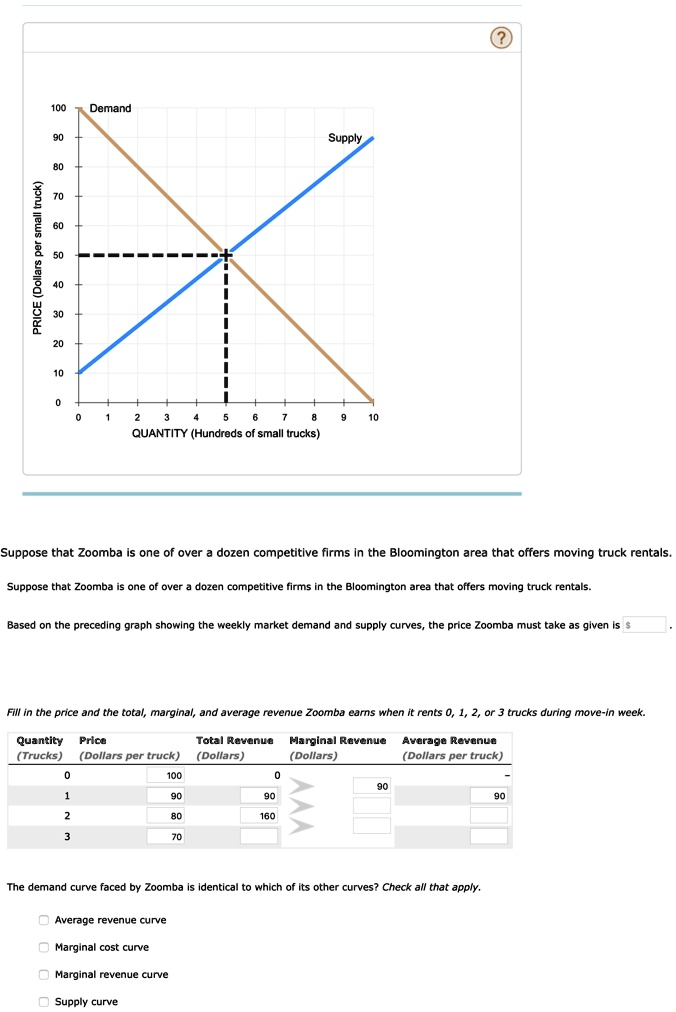
Suppose that Zoomba is one of over a dozen competitive firms in the Bloomington area that offers moving truck rentals.
Suppose that Zoomba is one of over a dozen competitive firms in the Bloomington area that offers moving truck rentals.
Based on the preceding graph showing the weekly market demand and supply curves, the price Zoomba must take as given is $
Fill in the price and the total, marginal, and average revenue Zoomba earns when it rents 0, 1, 2, or 3 trucks during move-in week.
Quantity Price
(Trucks) (Dollars per truck)
Total Revenue
(Dollars)
0
100
1
90
90
2
80
160
3
70
Marginal Revenue
(Dollars)
Average Revenue
(Dollars per truck)
90
90
The demand curve faced by Zoomba is identical to which of its other curves? Check all that apply.
Average revenue curve
Marginal cost curve
Marginal revenue curve
Supply curve