Im having issues with number eight, cant get it to come out the way of the image, i have the dataframe and have set the index but it's just not working.
1. Read the data from the .csv file into a DataFrame and display the first five rows.
2. Notice that the column names are inconsistent. Change the column names so they all use title case with no spaces.
3. Add a column with the percentage of the bags in the TotalBags column that are extra-large bags.
4. Add a column with the percentage of the bags in the TotalBags column that are large bags.
5. Add a column with the percentage of the bags in the TotalBags column that are small bags.
6. Display the first five rows of data to view the new columns.
7. Assign the Region, Type, Year, and TotalBags columns to a new DataFrame.
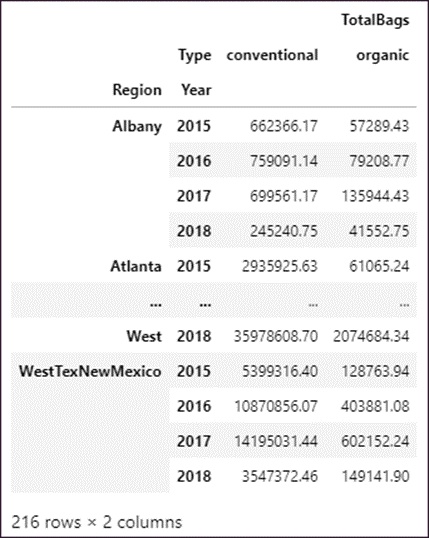
8. Group, sum, and unstack this data to produce a DataFrame that looks like this:
TotalBags
Type conventional organic
TotalBags
Type conventional organic
Region Year
Albany 2015 662366.17 57289.43
2016 759091.14 79208.77
2017 699561.17 135944.43
2018 245240.75 41552.75
Atlanta 2015 2935925.63 61065.24
..
West 2018 35978608.70 2074684.34
WestTexNewMexico 2015 5399316.40 128763.94
2016 10870856.07 403881.08
2017 14195031.44 602152.24
2018 3547372.46 149141.90
216 rows x 2 columns