Refer to the diagram.
PRICE
100
90
SUPPLY
80
60
60
650
50
40
0
30
20
10
DEMAND 1
DEMAND2
0
0
40 80 120 160 200 240 280 320 360 400 440 480 520 560 600
QUANTITY
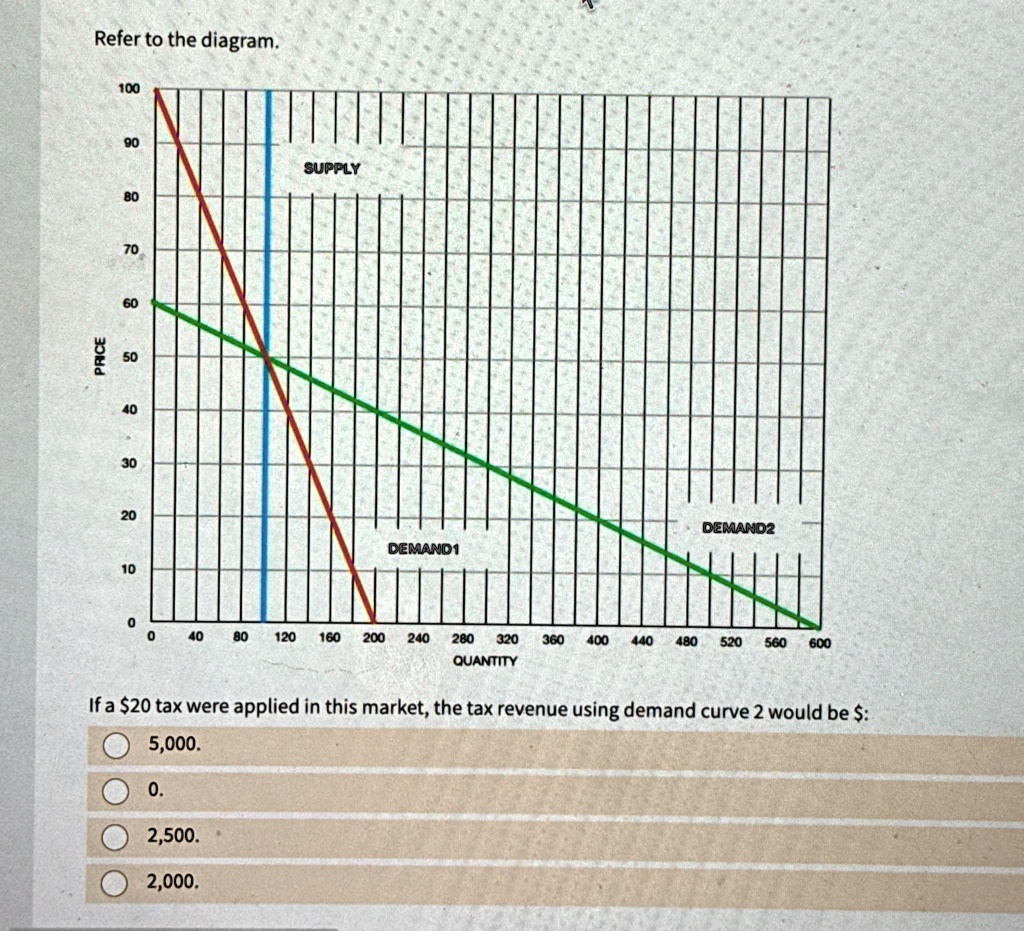
If a $20 tax were applied in this market, the tax revenue using demand curve 2 would be $:
5,000.
0.
2,500.
2,000.