Operational and Financial Summary
Case Information: Aritzia Inc.
Requirement 3
Evaluate the company’s ability to sell inventory and pay debts during 2022 and 2021. In your analysis, you should compute the following ratios, and then comment on what those ratios indicate.
1. Accounts receivable turnover
2. Inventory turnover
3. Accounts payable turnover and days’ payable outstanding
4. Cash conversion cycle
5. Current ratio
6. Quick (acid-test) ratio
7. Debt ratio
Requirement 4
Evaluate Aritzia’s cash flow.
1. For 2022, is Aritzia’s net cash flow from operations greater than or less than net income? What is the primary cause of the difference?
2. For 2021 and 2022, what is the primary source of cash from investing activities? What is the primary use of cash from investing activities for 2021 and 2022?
3. For 2021 and 2022, what is the primary source of cash from financing activities? What is the primary use of cash from financing activities for 2021 and 2022?
4. What trend(s) do you detect from this analysis?
Requirement 5
Evaluate Aritzia’s shares as an investment.
1. What was the closing market price of Aritzia’s shares on February 28, 2022, the next trading day after the balance-sheet date of February 27, 2022? Google Aritzia’s stock price on Yahoo Finance Aritzia’s ticker symbol is ATZ.TO.
2. Compute the price-earnings ratio using your EPS calculation and the market price you just determined.
3. Based on Management’s Discussion and Analysis (annual report) as well as any business news (Google Finance is an example), would you evaluate the company’s shares as a “buy,” “hold,” or “sell”? State your reason
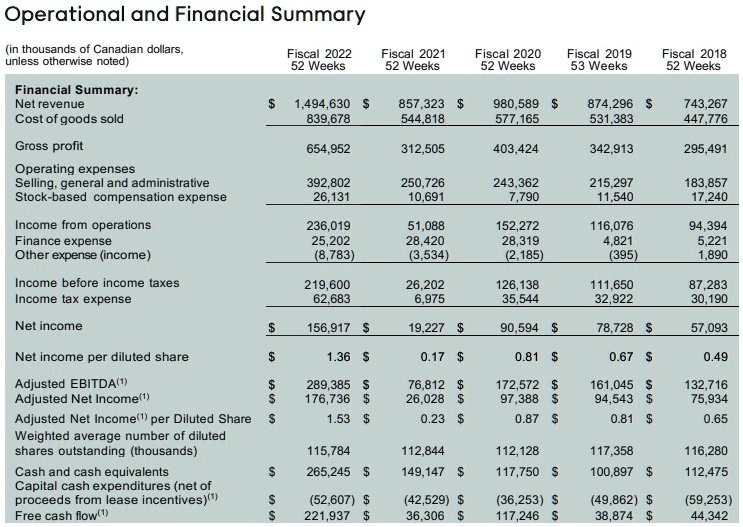
Operational and Financial Summary
(in thousands of Canadian dollars, unless otherwise noted)
Fiscal 2022 52 Weeks
Fiscal 2021 52 Weeks
Fiscal 2020 52 Weeks
Fiscal 2019 53 Weeks
Fiscal 2018 52 Weeks
Financial Summary: Net revenue Cost of goods sold
$1,494,630 $839,678
$857,323 $544,818
$980,589 $577,165
$874,296 $531,383
$743,267 $447,776
Gross profit
$654,952
$312,505
$403,424
$342,913
$295,491
Operating expenses Selling, general and administrative Stock-based compensation expense
$392,802 $26,131
$250,726 $10,691
$243,362 $7,790
$215,297 $11,540
$183,857 $17,240
Income from operations Finance expense Other expense (income)
$236,019 $25,202 ($8,783)
$51,088 $28,420 $3,534
$152,272 $28,319 ($2,185)
$116,076 $4,821 $395
$94,394 $5,221 $1,890
Income before income taxes Income tax expense
$219,600 $62,683
$26,202 $6,975
$126,138 $35,544
$111,650 $32,922
$87,283 $30,190
Net income
$156,917
$19,227
$90,594
$78,728
$57,093
Net income per diluted share
$1.36
$0.17
$0.81
$0.67
$0.49
Adjusted EBITDA(1) Adjusted Net Income(1) 55 Adjusted Net Income(1) per Diluted Share Weighted average number of diluted shares outstanding (thousands) Cash and cash equivalents Capital cash expenditures (net of proceeds from lease incentives) Free cash flow(1)
$289,385 $176,736 $1.53
$76,812 $26,028 $0.23
$172,572 $97,388 $0.87
$161,045 $94,543 $0.81
$132,716 $75,934 $0.65
$115,784 $265,245
$112,844 $149,147
$112,128 $117,750
$117,358 $100,897
$116,280 $112,475
$52,607 $221,937
($42,529) $36,306
$36,253 $117,246
($49,862) $38,874
($59,253) $44,342