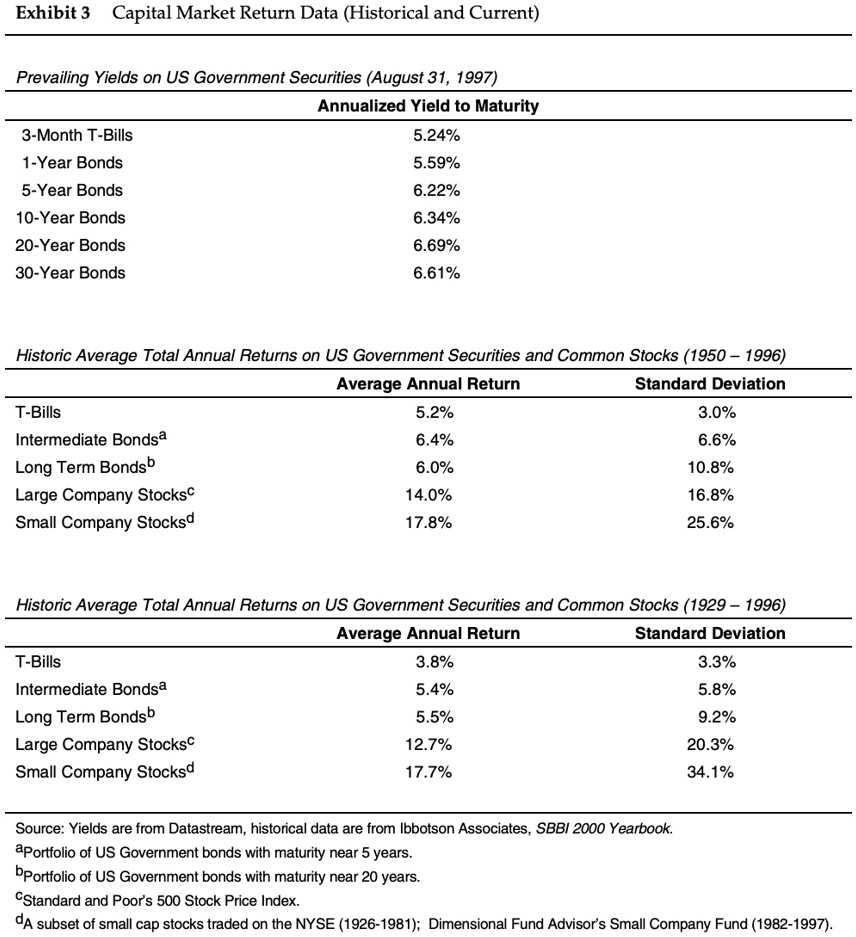
Exhibit 3 Capital Market Return Data (Historical and Current)
Prevailing Yields on US Government Securities (August 31, 1997)
3-Month T-Bills
1-Year Bonds
5-Year Bonds
10-Year Bonds
20-Year Bonds
30-Year Bonds
Annualized Yield to Maturity
5.24%
5.59%
6.22%
6.34%
6.69%
6.61%
Historic Average Total Annual Returns on US Government Securities and Common Stocks (1950-1996)
T-Bills
Intermediate Bondsa
Long Term Bondsb
Large Company Stocksc
Small Company Stocksd
Average Annual Return
5.2%
6.4%
6.0%
14.0%
17.8%
Standard Deviation
3.0%
6.6%
10.8%
16.8%
25.6%
Historic Average Total Annual Returns on US Government Securities and Common Stocks (1929-1996)
T-Bills
Intermediate Bondsa
Long Term Bondsb
Large Company Stocksc
Small Company Stocksd
Average Annual Return
3.8%
5.4%
5.5%
12.7%
17.7%
Standard Deviation
3.3%
5.8%
9.2%
20.3%
34.1%
Source: Yields are from Datastream, historical data are from Ibbotson Associates, SBBI 2000 Yearbook.
aPortfolio of US Government bonds with maturity near 5 years.
bPortfolio of US Government bonds with maturity near 20 years.
CStandard and Poor's 500 Stock Price Index.
dA subset of small cap stocks traded on the NYSE (1926-1981); Dimensional Fund Advisor's Small Company Fund (1982-1997).