Date
Official Low Temperatures - First Week of February
1
2
3
4
5
6
7
Temperature 25 27 31 27 24 23 23
Question 1
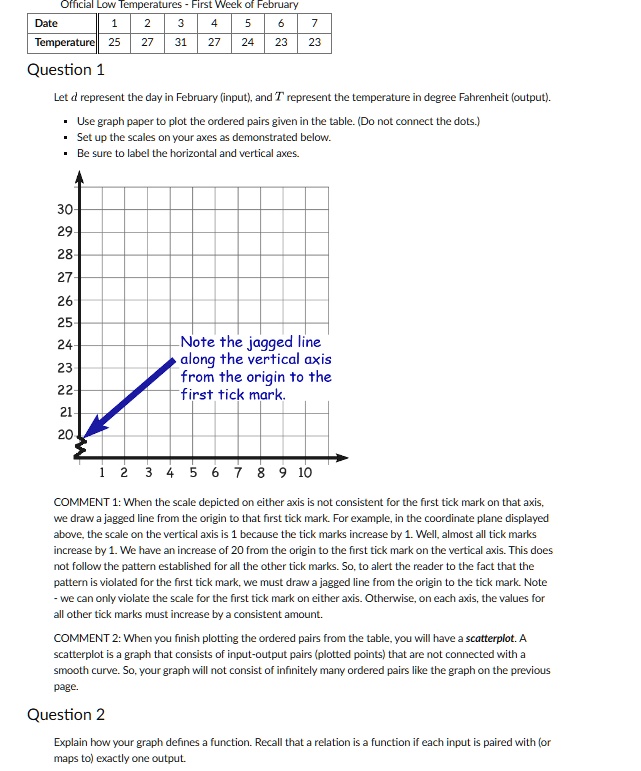
Let d represent the day in February (input), and T represent the temperature in degree Fahrenheit (output).
Use graph paper to plot the ordered pairs given in the table. (Do not connect the dots.)
Set up the scales on your axes as demonstrated below.
Be sure to label the horizontal and vertical axes.
30
29
28-
27
26
25-
24
23
Note the jagged line
along the vertical axis
from the origin to the
22-
first tick mark.
21-
20
1 2 3 4 5 6 7 8 9 10
COMMENT 1: When the scale depicted on either axis is not consistent for the first tick mark on that axis,
we draw a jagged line from the origin to that first tick mark. For example, in the coordinate plane displayed
above, the scale on the vertical axis is 1 because the tick marks increase by 1. Well, almost all tick marks
increase by 1. We have an increase of 20 from the origin to the first tick mark on the vertical axis. This does
not follow the pattern established for all the other tick marks. So, to alert the reader to the fact that the
pattern is violated for the first tick mark, we must draw a jagged line from the origin to the tick mark. Note
we can only violate the scale for the first tick mark on either axis. Otherwise, on each axis, the values for
all other tick marks must increase by a consistent amount.
COMMENT 2: When you finish plotting the ordered pairs from the table, you will have a scatterplot. A
scatterplot is a graph that consists of input-output pairs (plotted points) that are not connected with a
smooth curve. So, your graph will not consist of infinitely many ordered pairs like the graph on the previous
page.
Question 2
Explain how your graph defines a function. Recall that a relation is a function if each input is paired with (or
maps to) exactly one output.