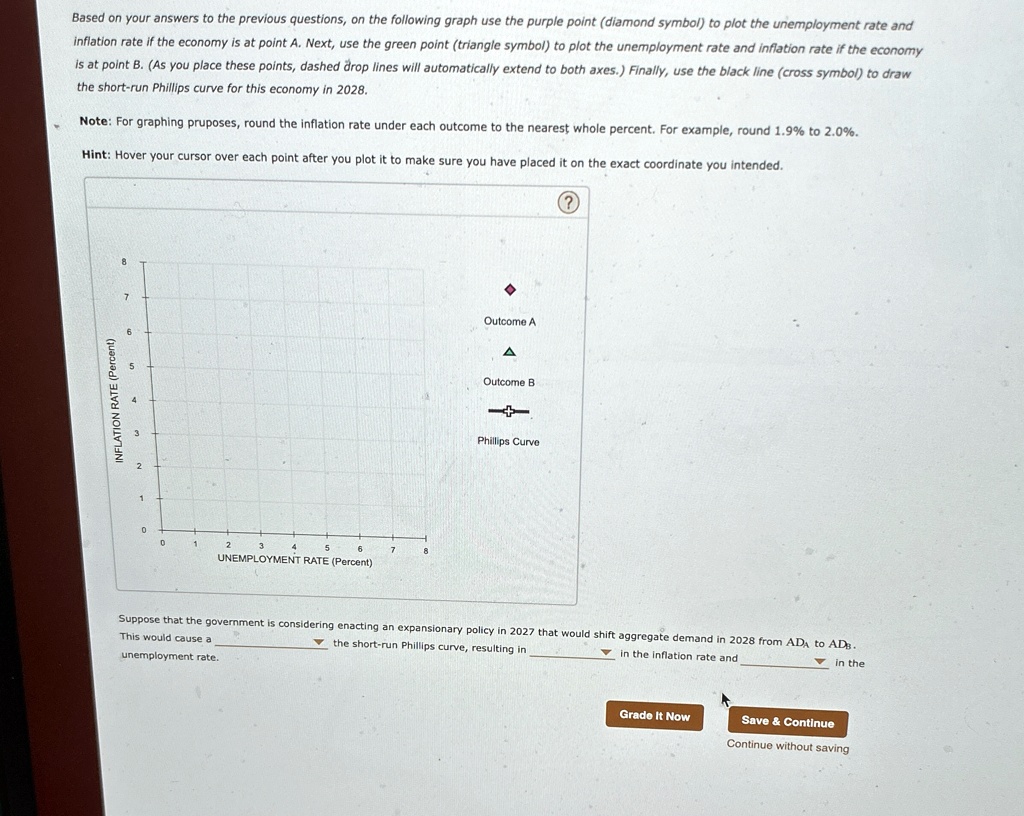
Based on your answers to the previous questions, on the following graph use the purple point (diamond symbol) to plot the unemployment rate and inflation rate if the economy is at point A. Next, use the green point (triangle symbol) to plot the unemployment rate and inflation rate if the economy is at point B. (As you place these points, dashed drop lines will automatically extend to both axes.) Finally, use the black line (cross symbol) to draw the short-run Phillips curve for this economy in 2028.
Note: For graphing pruposes, round the inflation rate under each outcome to the nearest whole percent. For example, round 1.9% to 2.0%.
Hint: Hover your cursor over each point after you plot it to make sure you have placed it on the exact coordinate you intended.
Suppose that the government is considering enacting an expansionary policy in 2027 that would shift aggregate demand in 2028 from ADA to ADB.
This would cause a the short-run Phillips curve, resulting in in the inflation rate and in the unemployment rate.