7) Monopoly II (6 points)
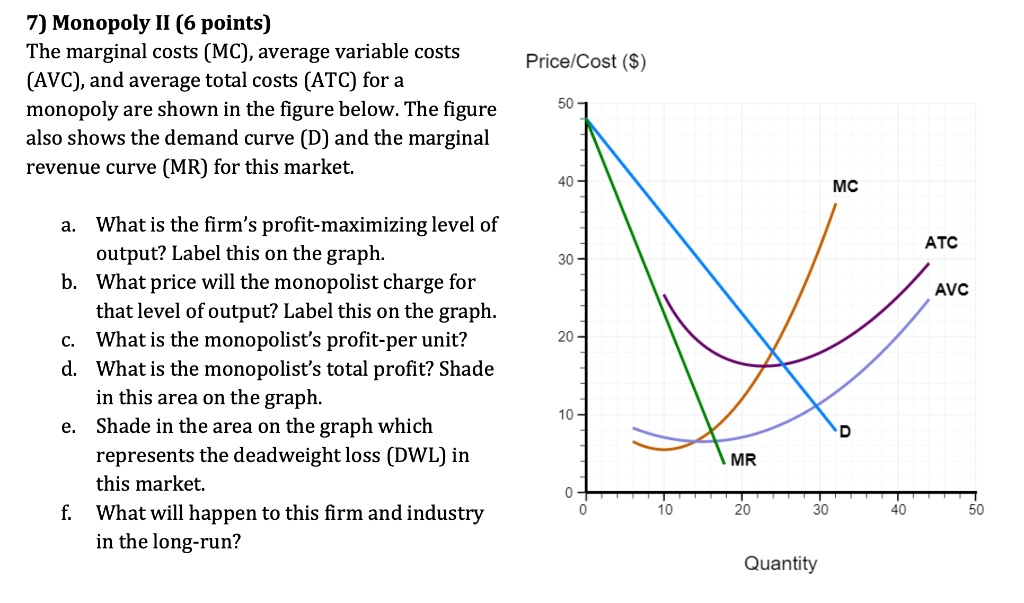
The marginal costs (MC), average variable costs
(AVC), and average total costs (ATC) for a
monopoly are shown in the figure below. The figure
also shows the demand curve (D) and the marginal
revenue curve (MR) for this market.
a. What is the firm's profit-maximizing level of
output? Label this on the graph.
b. What price will the monopolist charge for
that level of output? Label this on the graph.
c. What is the monopolist's profit-per unit?
d. What is the monopolist's total profit? Shade
in this area on the graph.
e. Shade in the area on the graph which
represents the deadweight loss (DWL) in
this market.
f. What will happen to this firm and industry
in the long-run?