Ace - AI Tutor
Ask Our Educators
Textbooks
My Library
Flashcards
Scribe - AI Notes
Notes & Exams
Download App
douglas iriarte

douglas i.

Divider

Questions asked

BEST MATCH

The beehive generates a negative externality if the farmer spends nearly all his time tending the bees and rare generates a negative externality if the bees are killed by a colony of wasps. generates a positive externality if the rooftop gardens benefit from the pollination and a negative eighbors get stung by bees. generates a positive externality if the farmer creates a successful online business that sells produc bees' honey.

View Answer
divider
BEST MATCH

Question 35 When a customer leaves your business, the term we use to identify this is O collide. O churn. O converge. O cease. 2 pts

View Answer
divider
BEST MATCH

Do you believe Butler's theory that a calorie-restricting diet will slow the process of aging? Why or why not? Be specific in your rationalization.

View Answer
divider
BEST MATCH

You find yourself studying Mendel's pea plants. You cross a purple flowered tall plant (PpTt) with a white flowered short plant (pptt) and get 328 pea plants I What are the expected phenotypic frequencies AND expected number for each phenotype of the offspring? (1 pts) You observe the following number of phenotypes in the offspring. Using your observed and expected phenotypes, calculate the chi-square value (1 pts) 80-Purple Tall plants 84-White tall plants 78-Purple short plants 86-White short plants

View Answer
divider
BEST MATCH

5- Calculate the multiplication of the following matrices $\begin{bmatrix} 1 & 2 & 2 \ 0 & 0 & 3 \ 1 & 3 & -1 \end{bmatrix} \times \begin{bmatrix} 1 & 2 \ 3 & -1 \ 1 & 1 \end{bmatrix}$

View Answer
divider
BEST MATCH

Unit 1 Day 5 Classwork Name: 1. A random sample of bills yields the following cell phone costs per month: $35.45, $42.30, $39.55, $39.00, $43.70. Find the range, population variance $\sigma^2$, population standard deviation $\sigma$, sample variance $s^2$, and sample standard deviation, s. Round to 3 decimal places. X $\bar{X}$ Population Variance, $\sigma^2$: Population Standard Deviation, $\sigma$: Sample Variance, $s^2$: Sample Standard Deviation, s: Range:

View Answer
divider
BEST MATCH

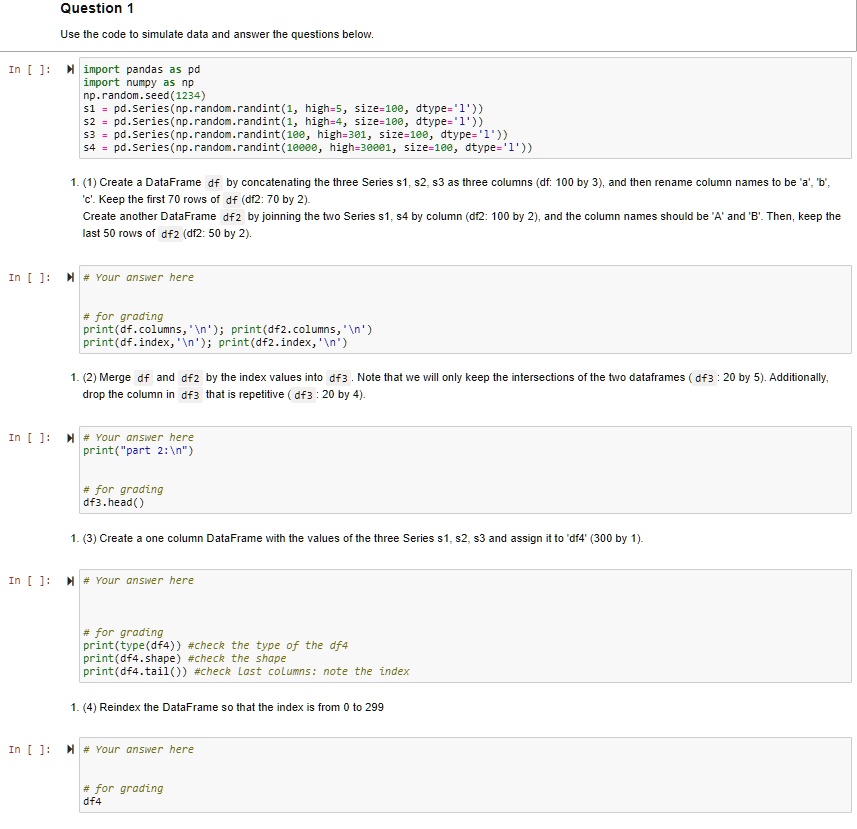
Text: Python How not clear? Question 1 Use the code to simulate data and answer the questions below. In [ ]: import pandas as pd import numpy as np np.random.seed(1234) s1 = pd.Series(np.random.randint(1, high=5, size=10, dtype='l')) s2 = pd.Series(np.random.randint(1, high=4, size=10, dtype='l')) s3 = pd.Series(np.random.randint(1e1, high=3e1, size=1e1, dtype='1')) s4 = pd.Series(np.random.randint(1e3, high=3e4, size=1e1, dtype='1')) 1. (1) Create a DataFrame df by concatenating the three Series s1, s2, s3 as three columns (df: 100 by 3), and then rename column names to be 'a', 'b', 'c'. Keep the first 70 rows of df (df2: 70 by 3). Create another DataFrame df2 by joining the two Series s1, s4 by column (df2: 100 by 2), and the column names should be 'A' and 'B'. Then, keep the last 50 rows of df2 (df2: 50 by 2). In [ ]: # Your answer here # for grading print(df.columns,'\n') print(df2.columns,'\n') print(df.index,'\n') print(df2.index,'\n') 1. (2) Merge df and df2 by the index values into df3. Note that we will only keep the intersections of the two dataframes (df3: 20 by 5). In [ ]: # Your answer here print("part 2:\n") # for grading df3.head() 1. (3) Create a one column DataFrame with the values of the three Series s1, s2, s3 and assign it to df4 (300 by 1). In [ ]: # Your answer here # for grading print(type(df4)) #check the type of df4 print(df4.shape) #check the shape print(df4.tail()) #check last columns: note the index 1. (4) Reindex the DataFrame so that the index is from 0 to 299. In [ ]: # Your answer here # for grading df4
View Answer
divider
BEST MATCH

a. Realize the given expression using $V_{out} = (A + BC)(D + E)$ i. Pseudo NMOS logic; (5 Marks) ii. Dynamic Domino Logic (5 Marks)

View Answer
divider
BEST MATCH

QUESTION 5 (5 Marks) A product is made up of six subassemblies as shown in Figure 4. Table 2 shows the failure rate (?) of each subassembly based on tests of 10,000 hours duration. Use this data to determine the reliability of the product after 2,500 hours of operation. The relationship between reliability and failure rate is represented by equation: $R = e^{-\lambda t}$ I/P 1 4 2 5 O/P 6 3 Figure 4 Table 2 Component Failure rate 1 0.1 2 0.08 3 0.12 4 0.15 5 0.2 6 0.1

View Answer
divider
BEST MATCH

Find two positive numbers such that the sum of the squares of the two numbers is 169 and the difference between the two numbers is 7.

View Answer
divider