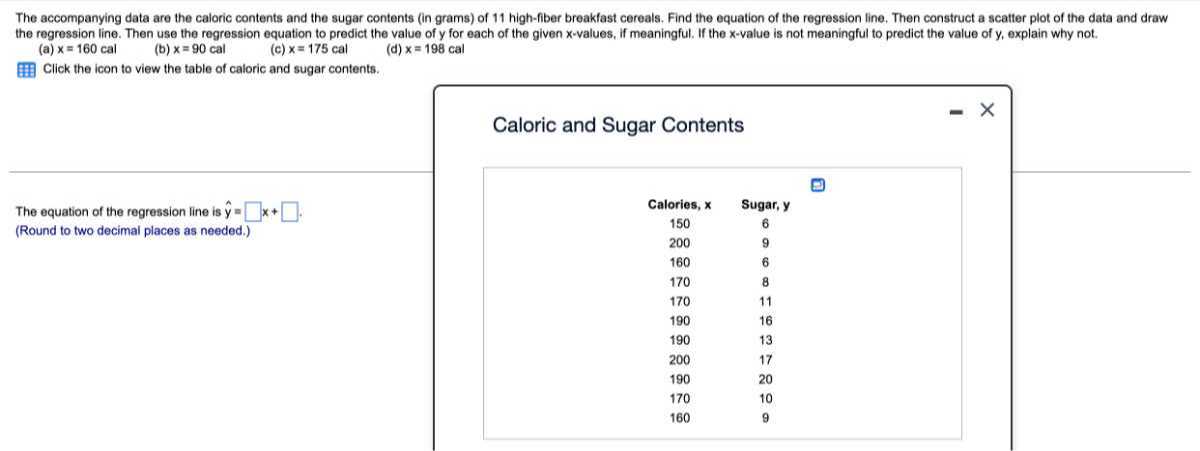
The accompanying data are the caloric contents and the sugar contents (in grams) of 11 high-fiber breakfast cereals. Find the equation of the regression line. Then construct a scatter plot of the data and draw the regression line. Then use the regression equation to predict the value of \( y \) for each of the given \( x \)-values, if meaningful. If the \( x \)-value is not meaningful to predict the value of \( y \), explain why not.
(a) \( \mathrm{x}=160 \mathrm{cal} \)
(b) \( \mathrm{x}=90 \mathrm{cal} \)
(c) \( \mathrm{x}=175 \mathrm{cal} \)
(d) \( \mathrm{x}=198 \mathrm{cal} \)
Click the icon to view the table of caloric and sugar contents.
Caloric and Sugar Contents
The equation of the regression line is \( \hat{y}= \) \( \square \)
\( \square \) .
(Round to two decimal places as needed.)
\begin{tabular}{|cc|}
\hline & \\
Calories, \( \mathbf{x} \) & Sugar, \( \boldsymbol{y} \) \\
150 & 6 \\
200 & 9 \\
160 & 6 \\
170 & 8 \\
170 & 11 \\
190 & 16 \\
190 & 13 \\
200 & 17 \\
190 & 20 \\
170 & 10 \\
160 & 9 \\
& \\
\hline
\end{tabular}