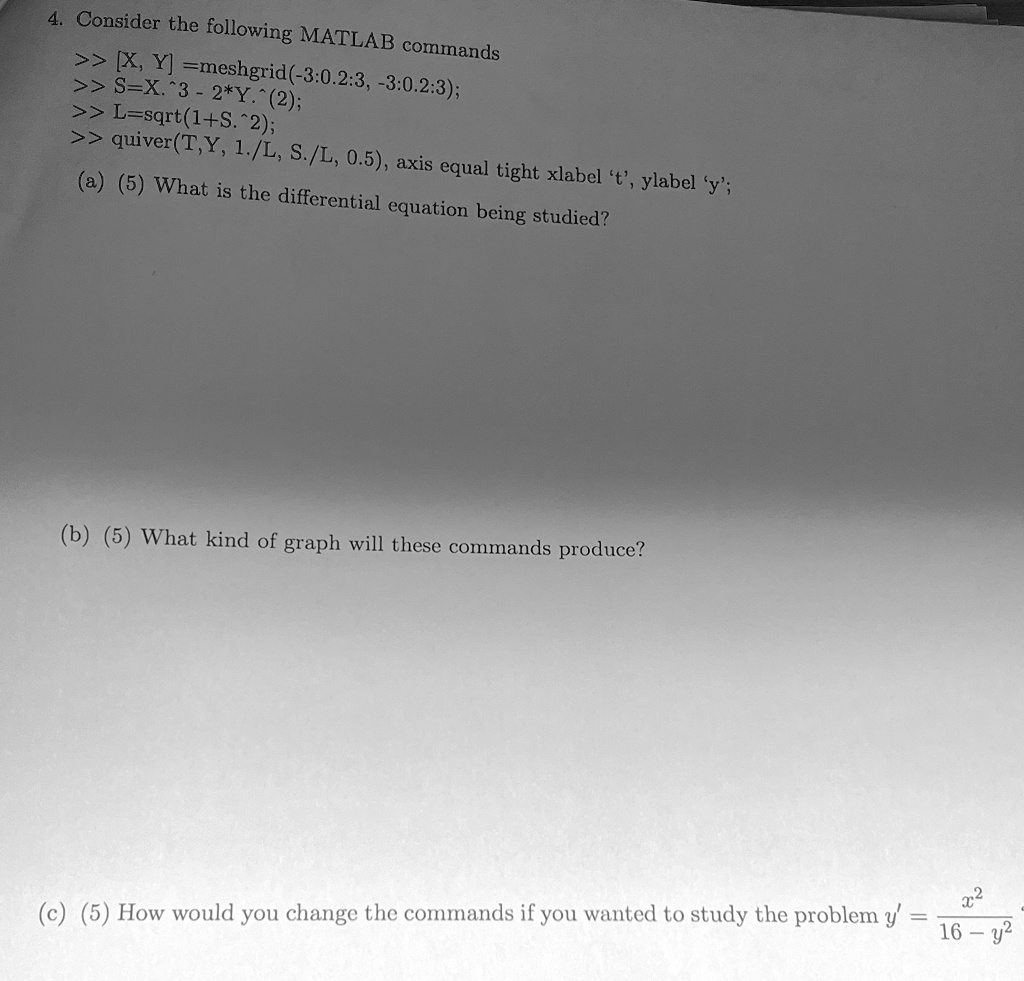
4. Consider the following MATLAB commands
>> [X, Y] =meshgrid(-3:0.2:3, -3:0.2:3);
>> S=X.^3 - 2*Y.^2;
>> L=sqrt(1+S.^2);
>> quiver(T,Y, 1./L, S./L, 0.5), axis equal tight xlabel 't', ylabel 'y';
(a) (5) What is the differential equation being studied?
(b) (5) What kind of graph will these commands produce?
(c) (5) How would you change the commands if you wanted to study the problem $y' = \frac{x^2}{16 - y^2}$