Suppose that the average temperature in Lincoln, NE in degrees Fahrenheit \(t\) months after January 1, 2016 (that is, January 1 corresponds to \(t = 0\)) is given by the following equation:
\(T(t) = -50 \cos\left(\frac{\pi}{6}t\right) + 70.\)
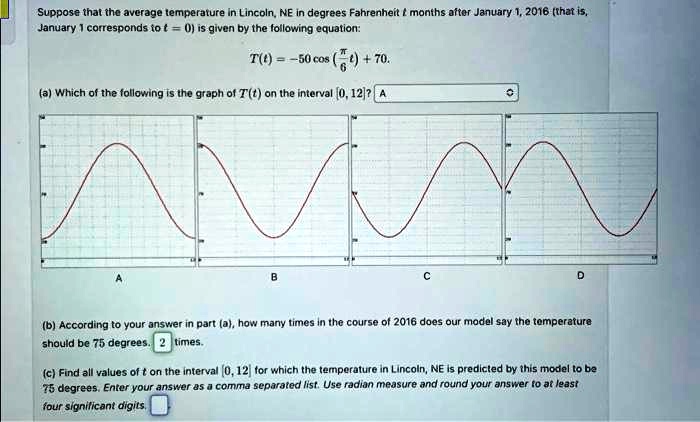
(a) Which of the following is the graph of \(T(t)\) on the interval \([0, 12]\)?
A
B
C
D
(b) According to your answer in part (a), how many times in the course of 2016 does our model say the temperature should be 75 degrees. 2 times.
(c) Find all values of \(t\) on the interval \((0, 12]\) for which the temperature in Lincoln, NE is predicted by this model to be 75 degrees. Enter your answer as a comma separated list. Use radian measure and round your answer to at least four significant digits.