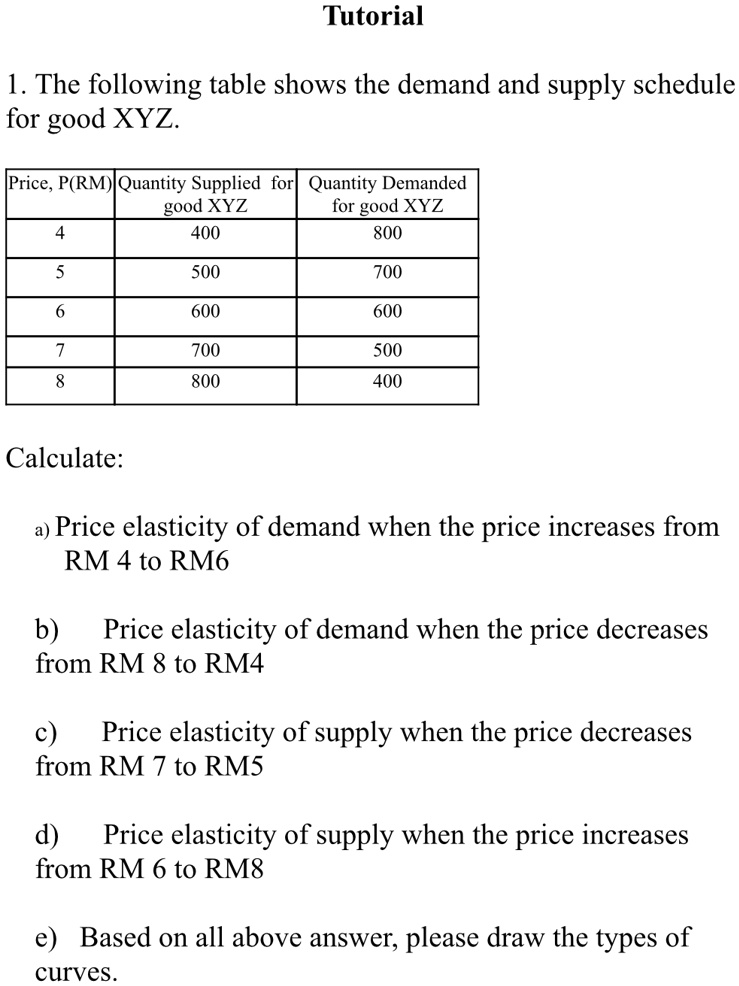
The following table shows the demand and supply schedule for good XYZ.
able[[Price, P(RM), able[[Quantity Supplied for],[good XYZ]], able[[Quantity Demanded],[for good XYZ]]],[4,400,800],[5,500,700],[6,600,600],[7,700,500],[8,800,400]]
Calculate:
a) Price elasticity of demand when the price increases from RM 4 to RM6
b) Price elasticity of demand when the price decreases from RM 8 to RM4
c) Price elasticity of supply when the price decreases from RM 7 to RM5
d) Price elasticity of supply when the price increases from RM 6 to RM8
e) Based on all above answer, please draw the types of curves.
Tutorial
1. The following table shows the demand and supply schedule for good XYZ.
Price, P(RM)[Quantity Supplied for Quantity Demanded good XYZ for good XYZ 4 400 800
5
500
700
6
600
600
7 8
700 800
500 400
Calculate:
a) Price elasticity of demand when the price increases from RM 4 to RM6
b) Price elasticity of demand when the price decreases from RM 8 to RM4
c) Price elasticity of supply when the price decreases from RM 7 to RM5
(p Price elasticity of supply when the price increases from RM 6 to RM8
e) Based on all above answer, please draw the types of curves.