Type 'help("SpeciesArea")' into the R console to read about the
dataset on islands in Southeast Asia.
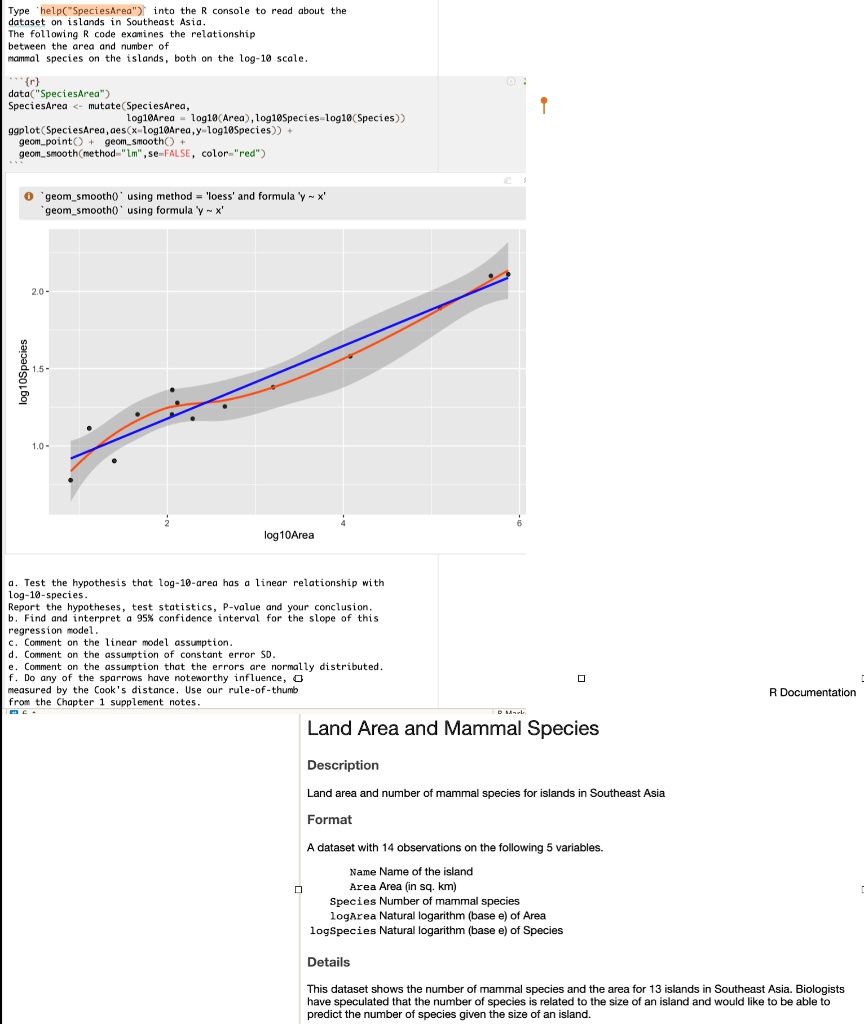
The following R code examines the relationship
between the area and number of
mammal species on the islands, both on the log-10 scale.
```r
data("SpeciesArea")
SpeciesArea <- mutate(SpeciesArea,
log10Area = log10(Area), log10Species = log10(Species))
ggplot(SpeciesArea, aes(x = log10Area, y = log10Species)) +
geom_point() + geom_smooth() +
geom_smooth(method = "lm", se = FALSE, color = "red")
```
`geom_smooth()` using method = 'loess' and formula 'y ~ x'
`geom_smooth()` using formula 'y ~ x'
a. Test the hypothesis that log-10-area has a linear relationship with
log-10-species.
Report the hypotheses, test statistics, P-value and your conclusion.
b. Find and interpret a 95% confidence interval for the slope of this
regression model.
c. Comment on the linear model assumption.
d. Comment on the assumption of constant error SD.
e. Comment on the assumption that the errors are normally distributed.
f. Do any of the sparrows have noteworthy influence,
measured by the Cook's distance. Use our rule-of-thumb
from the Chapter 1 supplement notes.
Land Area and Mammal Species
Description
Land area and number of mammal species for islands in Southeast Asia
Format
A dataset with 14 observations on the following 5 variables.
Name Name of the island
Area Area (in sq. km)
Species Number of mammal species
logArea Natural logarithm (base e) of Area
logSpecies Natural logarithm (base e) of Species
Details
This dataset shows the number of mammal species and the area for 13 islands in Southeast Asia. Biologists
have speculated that the number of species is related to the size of an island and would like to be able to
predict the number of species given the size of an island.