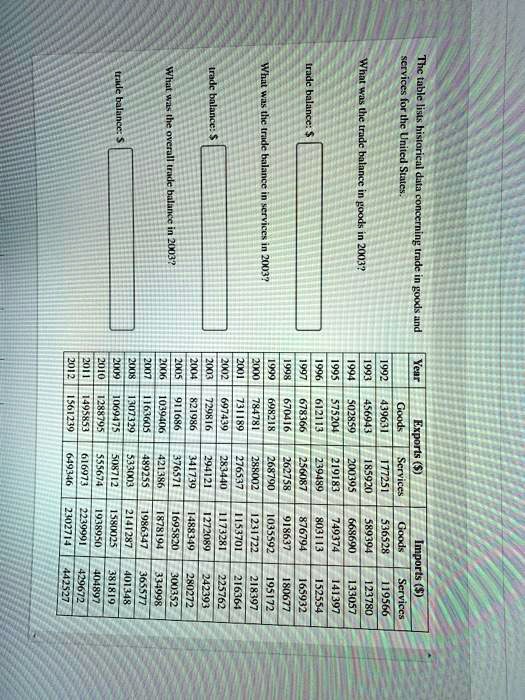
Trade balance: $ trade balance: $ services for the United States. What was the overall trade balance in 2003? What was the trade balance in services in 2003? What was the trade balance in goods in 2003? The table lists historical data concerning trade in goods and services for the years 2011, 2010, 2009, 2008, 2007, 2006, 2005, 2004, 2003, 2002, 2001, 2000, 1999, 1998, 1997, 1996, 1995, 1994, 1993, and 1992.
Year Exports ($) Imports ($) Goods Services
2012 561,239 1,495,853 288,795 69,475
2011 1,307,329 1,636,059 394,406 911,686
2010 821,986 729,816 697,439 731,189
2009 784,780 698,218 670,416 678,366
2008 612,113 575,204 502,859 456,943
2007 439,631 439,631 439,631 439,631
2006 649,346 616,973 555,674 508,712
2005 533,003 489,255 421,386 376,571
2004 341,739 294,121 283,440 276,537
2003 288,002 268,790 262,758 256,087
2002 239,489 219,183 200,395 85,920
2001 772,251 2,302,714 223,999 1,938,950
2000 1,580,025 2,141,287 1,986,347 1,878,194
1999 488,349 1,272,089 173,281 1,153,701
1998 231,722 1,035,592 918,637 876,794
1997 803,349 749,374 668,690 589,394
1996 536,528 502,859 456,943 439,631
1995 429,672 404,897 365,577 334,998
1994 381,819 401,348 300,352 280,272
1993 242,393 225,762 216,364 218,397
1992 195,172 180,677 165,932 152,554