Ace - AI Tutor
Ask Our Educators
Textbooks
My Library
Flashcards
Scribe - AI Notes
Notes & Exams
Download App
elizabeth calderon

elizabeth c.

Divider

Questions asked

BEST MATCH

If a patient sustains trauma that leads to a loss of pain sensation on the right side of the body below the neck, where is the most likely site of injury? The left extrapyramidal tract The medullary pyramids The left spinothalamic tract The right thalamus

View Answer
divider
BEST MATCH

What technique is used to compare the expression or presence of transcripts or proteins depending on the method? Gel electrophoresis Mass spectrometry RNA microarrays and RNA-seq RNA interference (RNAi)

View Answer
divider
BEST MATCH

The number of spices used in a typical recipe in a culture's cuisine is \_\_\_\_\_ correlated with the mean temperature in the culture's region. not negatively positively inversely

View Answer
divider
BEST MATCH

the store employee changed on $8.00 price sticket to $2.50 and priced it on the sale shelf

View Answer
divider
BEST MATCH

Calculate the \( 80^{\text {th }} \) percentile of the data summarised in the frequency table below: \begin{tabular}{|c|c|} \hline Category & \( \boldsymbol{f} \) \\ \hline\( [4,9) \) & 8 \\ \hline\( [9,17) \) & 19 \\ \hline\( [17,23) \) & 22 \\ \hline\( [23,28) \) & 18 \\ \hline\( [28,30) \) & 15 \\ \hline \end{tabular} Select one: a. 26.656 b. 16.333 c. 15.989 d. 18.879 e. 27.611

View Answer
divider
BEST MATCH

6-18. For the two devices below, construct bond graph models, derive state equations, and derive transfer functions relating $v_m(s)$ to $v_i(s)$. Turn these transfer functions into frequency-response functions and sketch $|v_m/v_i|$ versus frequency. Comment on how these devices compare with respect to vibration isolation.

View Answer
divider
BEST MATCH

250 mL of 1.00 M Ca3(NH4)6(SO4)2 is mixed with 200 mL of 0.5 M Sr6(SO4)3(Cl)3. 25 mL of the sample is mixed with 325 mL of pure water. Calculate the concentration of sulfate.

View Answer
divider
BEST MATCH

Part A: Gobble til you wobble 255 students were discussing they ate over Thanksgiving Break. Four of the most commonly listed dishes were: turkey, sweet potatoes, stuffing, and pumpkin pie. Six of the students did not celebrate Thanksgiving or eat any of those foods. Six other students just ate pumpkin pie. Twice as many students ate only turkey, stuffing, and sweet potatoes as students that ate only stuffing, sweet potatoes and pumpkin pie. Three students ate only the pumpkin pie and stuffing. 220 students ate turkey; 105 students ate sweet potatoes; 144 students ate stuffing; and 156 students ate pumpkin pie. 86 students had turkey and sweet potatoes. 57 students ate sweet potatoes and pumpkin pie. 130 students ate both turkey and pumpkin pie. 65 students had sweet potatoes and stuffing. 125 students ate turkey and stuffing. 78 students had both pumpkin pie and stuffing. 60 students ate turkey, stuffing and pumpkin pie. Solve for the probability of a student eating all possible combinations of those foods using linear algebra. Present your results on a Venn Diagram. \*\*try to write your equations in order described in the problem statement

View Answer
divider
BEST MATCH

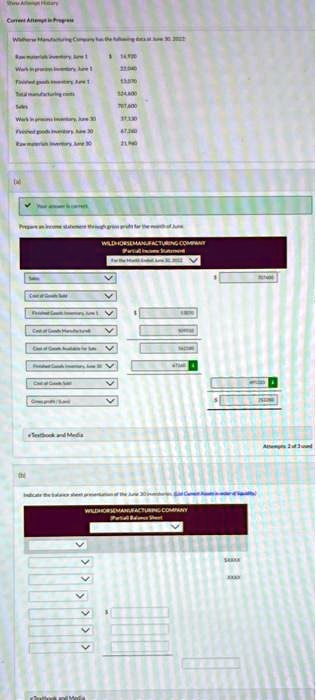
Current Attempt in Progress Wildhorse Manufacturing Company has the following data as of June 30, 2022: Raw materials inventory, June 1 $ 14,700 Work in process inventory, June 1 23,000 Finished goods inventory, June 1 33,600 Total manufacturing costs 124,400 Sales 707,400 Work in process inventory, June 30 37,100 Finished goods inventory, June 30 47,200 Raw materials inventory, June 30 21,100 Prepare an income statement through gross profit for the month of June. WILDHORSE MANUFACTURING COMPANY Partial Income Statement For the Month Ended June 30, 2022 Indicate the balance sheet presentation of the June 30 inventories. List Current Assets in order of liquidity.
View Answer
divider
BEST MATCH

Texts: Instructions: For each hypothesis test, list the following: hypotheses, test statistic, p-value, decision, and conclusion in Word. Beneath the conclusion, paste a copy of your StatCrunch output. Remember to answer any follow-up questions! Manual calculations will NOT be accepted. Problem 5: Michele works at Neutrogena and is considering the purchase of a new line to fill bottles of sunscreen for sale. The current line sampled 50 bottles and found a mean fill of 6.8 oz with a standard deviation of 0.2 oz. The line being considered sampled 48 bottles and found a mean fill of 6.8 oz with a variance of 0.035 oz^2. At the 0.05 level of significance, is there sufficient evidence to conclude that the new line has less variation than the current line? Should Michele recommend purchasing the line?

View Answer
divider