Ace - AI Tutor
Ask Our Educators
Textbooks
My Library
Flashcards
Scribe - AI Notes
Notes & Exams
Download App
elizabeth peters

elizabeth p.

Divider

Questions asked

BEST MATCH

Define new addition $\boxplus$ and multiplication $\square$ on $\mathbb{Q}$ by $a \boxplus b = a + b + 3$ and $a \square b = ab + 3a + 3b + 6$. Prove with these new operations $\mathbb{Q}$ is a commutative ring with unity.

View Answer
divider
BEST MATCH

24 Metacognitive skills include all of the following EXCEPT ignoring one's own mental processes. 27 monitoring one's own mental processes. planning one's own mental processes. evaluating one's own mental processes.

View Answer
divider
BEST MATCH

The pKa of phenol is 10.00. At what pH is phenol 15% ionized?

View Answer
divider
BEST MATCH

6. Sabiendo que \( 2,077 \mathrm{~m}^{3} \) de aire pesan \( 2,7 \mathrm{~kg} \), calcular lo que pesa \( 1 \mathrm{~m}^{2} \) de aire.

View Answer
divider
BEST MATCH

92. ?? ????????, ?? ????? ?? ??. 1120 ??? ????? ?? ?? ??? ??? ?????? ???? ??? ??? ??. 400 ??? ????? ?? ???? ???? ????, ??? ?? 17 ???? ?? ????? ??? ??? ?? \( 10 \% \) ?? ??? ????? ????? ??, ?? ??? ????? ?? ??? ???? ?? ????? ?????? ( ??. ??? )

View Answer
divider
BEST MATCH

The length of a shadow of a tree is 195 feet when the angle of elevation of the sun is 31°. Approximate the height of the tree in feet. (Round your answer to one decimal place.)

View Answer
divider
BEST MATCH

Attached is an article about: An Algorithm of Fuzzy Inference System for ISAR Image Classification cited as: Environment. Technology. Resources, Rezekne, Latvia Proceedings of the 11th International Scientific and Practical Conference. Volume II, 154-158. Example of (ISAR image) is below: Range(m) Range(m) -15 -10 -5 0 5 10 15 -20 -15 -10 -5 0 5 10 15 20 Cross-range(m) (c) 6 3 8 10 9 12 02 08 14 -2 0 2 4 Cross-range(m) ISAR image image source: Ka-band microwave photonic ultra- wideband imaging radar for capturing quantitative target information. Design an Adaptive (ANFIS) Fuzzy Decision Based System for an: Inverse synthetic-aperture radar (ISAR): An image Processing Fuzzy Decision System. Write a code in (python, c++, or matlab) to implement this fuzzy inference systems as given in the article. Verify your results.

View Answer
divider
BEST MATCH

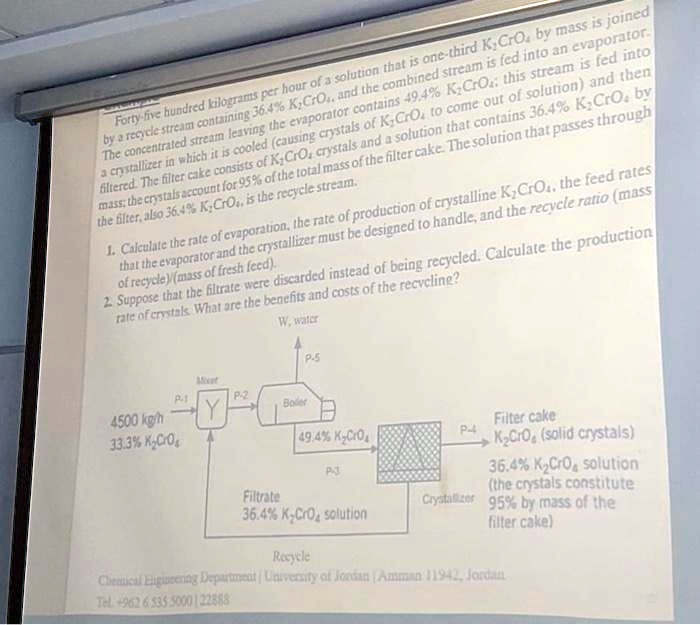
Forty-five hundred kilograms per hour of a solution that is one-third $K_2CrO_4$ by mass is joined by a recycle stream containing 36.4% $K_2CrO_4$, and the combined stream is fed into an evaporator. The concentrated stream leaving the evaporator contains 49.4% $K_2CrO_4$; this stream is fed into a crystallizer in which it is cooled (causing crystals of $K_2CrO_4$ to come out of solution) and then filtered. The filter cake consists of $K_2CrO_4$ crystals and a solution that contains 36.4% $K_2CrO_4$ by mass; the crystals account for 95% of the total mass of the filter cake. The solution that passes through the filter, also 36.4% $K_2CrO_4$, is the recycle stream. 1. Calculate the rate of evaporation, the rate of production of crystalline $K_2CrO_4$, the feed rates that the evaporator and the crystallizer must be designed to handle, and the recycle ratio (mass of recycle)/(mass of fresh feed). 2. Suppose that the filtrate were discarded instead of being recycled. Calculate the production rate of crystals. What are the benefits and costs of the recycling?

View Answer
divider
BEST MATCH

[15] For a monatomic linear lattice of N atoms with nearest-neighbor interactions (springs): a) [5] Find an exact expression for the heat capacity (analogous to equation (30) in Chapter 5 of Kittel) using the exact density of modes given in Kittel problem 5-1. Show that $C_V(T) \propto T$ at low temperatures. b) [5] Calculate the heat capacity in the Debye approximation. c) [5] Using Mathematica or some other software of your choice, make graphs of the two heat capacities as a function of temperature. Hint: To make graphs of this kind, it is useful to convert all physical variables to dimensionless quantities. For the temperature axis, define: $t = k_B T / \hbar \omega_{max}$ where $\omega_{max}$ is the maximum phonon frequency of the lattice. Your plot should cover the range of t between 0 and 2. For the heat capacity axis, plot $C_V$ in units of $Nk_B$, where N is the number of atoms in the lattice. You should find that the two results are identical both at low temperature and high temperature, but they differ somewhat in between. Try to explain why the exact result is slightly higher than the Debye result at intermediate temperatures.

View Answer
divider
BEST MATCH

Problem 1) Complex Numbers a) Convert the complex number z = 1+1j to the form $Ae^{j\phi}$, where A and $\phi$ are the magnitude and phase angle of complex number, respectively. b) Convert the complex number z = (1+1j)(-1+5j) to the form $Ae^{j\phi}$ c) Determine expressions for the magnitude and phase of the following complex function: $G(j\omega) = \frac{j\omega \tau}{1 + j\omega \tau}$. Assuming that $\tau$ = 10, plot the magnitude and phase vs. frequency. You should use a log-scale for the frequency.

View Answer
divider