The Gibbs Phase Rule
5. Problem 9.45 of the text
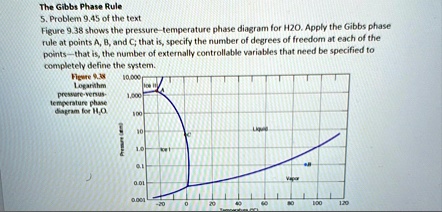
Figure 9.38 shows the pressure-temperature phase diagram for H2O. Apply the Gibbs phase
rule at points A, B, and C; that is, specify the number of degrees of freedom at each of the
points that is, the number of externally controllable variables that need be specified to
completely define the system.
Figure 9.38
Logarithm
pressure-versus-
temperature phase
diagram for H,O.
10,000
1,000
100
10
1.0
19
0.01
0.001
-20
0 20
40 40
T
A
80
100
120
--- OCR End ---