Note that in each diagram, we use four rectangles to estimate the area under y = v(t) on the interval 0, 2, but the method by which the four rectangles' respective heights are decided varies among the three individual graphs. A_(3) = v(1) * (1) / 2 = 2 * (1) / 2 = 1.
S = Use the rectangles in the middle diagram to find the value of T = B_(1) + B_(2) + B_(3) + B_(4).
T =
Use the rectangles in the right-most diagram to find the value of U = C_(1) + C_(2) + C_(3) + C_(4).
U =
Which estimate do you think is the best approximation of D, the total distance the person traveled on 0, 2? Why?
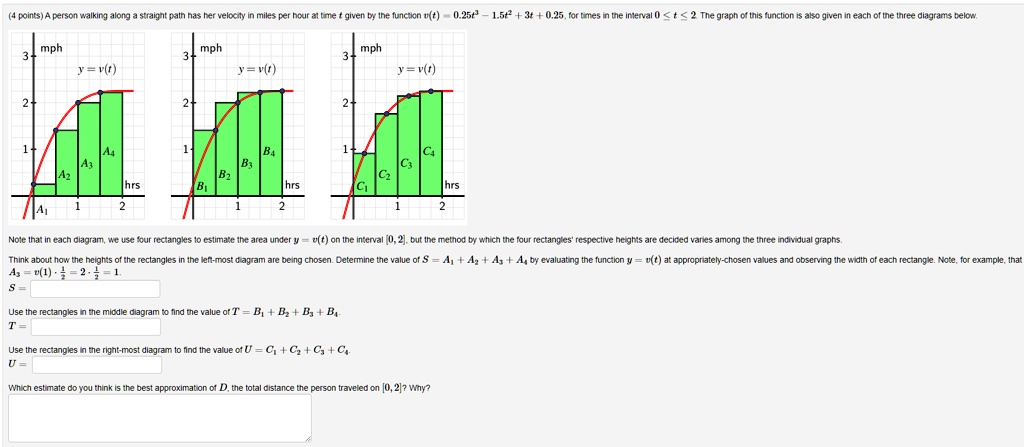
A person walking along the path is given by the function v(t) = 0.25t^3 + 1.52 + 3t + 0.25, for times in the interval 0 < t < 2. The graph of this function is also given in each of the three diagrams below.
Estimate the area under y = v(t) on the interval [0, 2], but the method by which the four rectangles' respective heights are decided varies among the three individual graphs.
Think about how the heights of the rectangles in the left-most diagram are being chosen. Determine the value of S = A + A + A + A, by evaluating the function y = v(t) at appropriately chosen values and observing the width of each rectangle. Note, for example, that A = v(1) = 2 = 1.
S =
Use the rectangles in the middle diagram to find the value of T = B_1 + B_2 + B_3 + B_4.
T =
Use the rectangles in the right-most diagram to find the value of U = C_1 + C_2 + C_3 + C_4.
U =
Which estimate do you think is the best approximation of D, the total distance the person traveled on [0, 2]? Why?