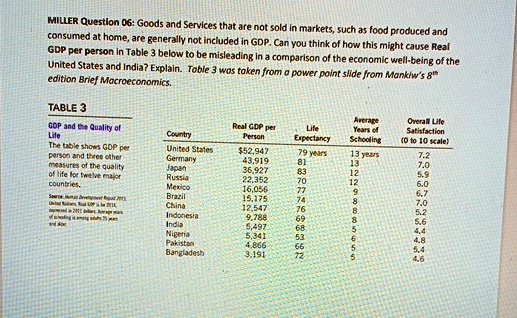
MILLER Question 06: Goods and Services that are not sold in markets, such as food produced and
consumed at home, are generally not included in GDP. Can you think of how this might cause Real
GDP per person in Table 3 below to be misleading in a comparison of the economic well-being of the
United States and India? Explain. Table 3 was taken from a power point slide from Mankiw's 8th
edition Brief Macroeconomics.
TABLE 3
GDP and the Quality of
Life
Country
Real GDP per
Person
Life
Expectancy
Average
Years of
Schooling
Overall Life
Satisfaction
(0 to 10 scale)
The table shows GDP per
United States
$52,947
person and three other
79 years
13 years
7.2
Germany
43,919
13
7.0
measures of the quality
Japan
36,927
83
12
5.9
of life for twelve major
Russia
22,352
70
12
6.0
countries.
Mexico
16,056
77
9
6,7
Brazil
15,175
74
8
7.0
China
12,547
76
8
5.2
Indonesia
9,788
69
8
5.6
India
5,497
68
5
4,4
Nigeria
5,341
53
5
4.8
Pakistan
4,866
66
5
5,4
Bangladesh
3.191
72
5
4.6