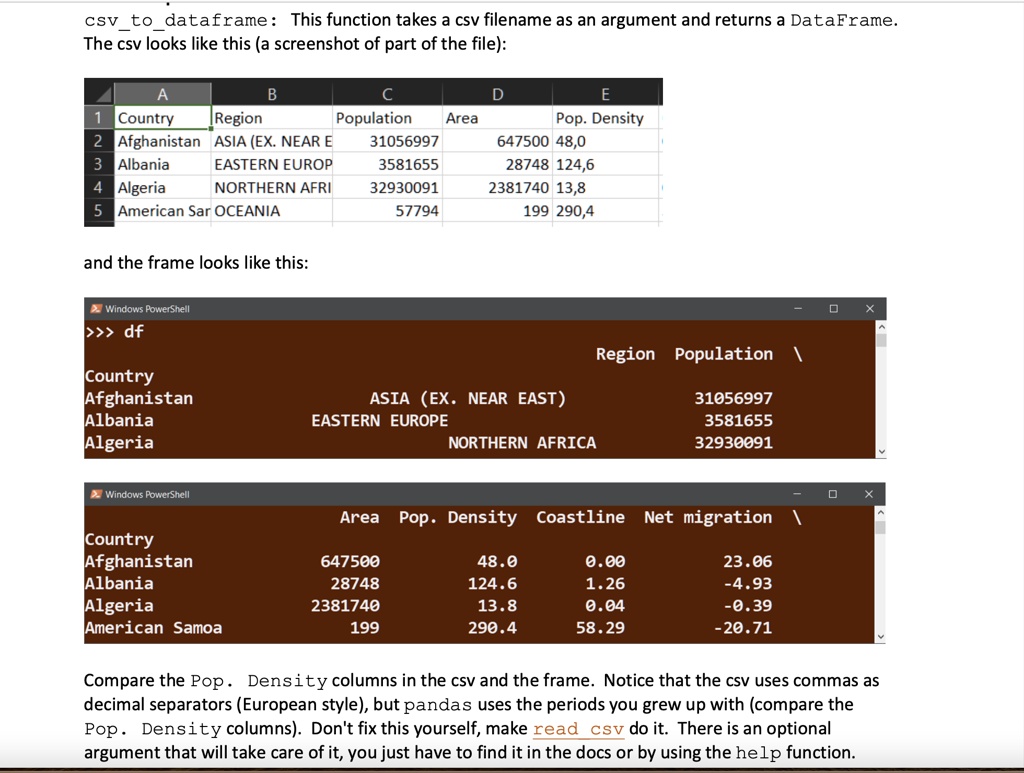
csv to dataframe: This function takes a csv filename as an argument and returns a DataFrame.
The csv looks like this (a screenshot of part of the file):
A
B
C
D
E
1 Country
Region
Population Area
Pop. Density
2 Afghanistan ASIA (EX. NEAR E
31056997
647500 48,0
3 Albania
EASTERN EUROP
3581655
28748 124,6
4 Algeria
NORTHERN AFRI
32930091
2381740 13,8
5 American Sar OCEANIA
57794
199 290,4
and the frame looks like this:
Windows PowerShell
>>> df
Region Population \
Country
Afghanistan
ASIA (EX. NEAR EAST)
31056997
Albania
EASTERN EUROPE
3581655
Algeria
NORTHERN AFRICA
32930091
Windows PowerShell
Area Pop. Density Coastline Net migration \
Country
Afghanistan
Albania
Algeria
American Samoa
647500
28748
2381740
199
48.0
124.6
13.8
290.4
0.00
1.26
0.04
58.29
23.06
-4.93
-0.39
-20.71
Compare the Pop. Density columns in the csv and the frame. Notice that the csv uses commas as
decimal separators (European style), but pandas uses the periods you grew up with (compare the
Pop. Density columns). Don't fix this yourself, make read csv do it. There is an optional
argument that will take care of it, you just have to find it in the docs or by using the help function.