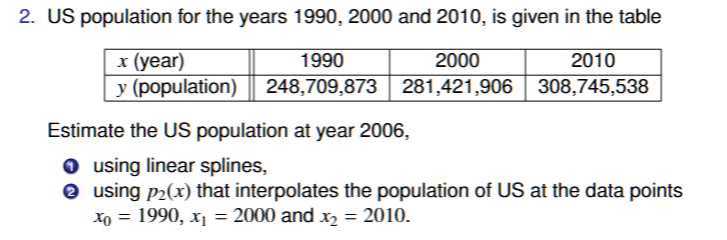
2. US population for the years 1990,2000 and 2010, is given in the table
\begin{tabular}{|l||c|c|c|}
\hline\( x \) (year) & 1990 & 2000 & 2010 \\
\hline\( y \) (population) & \( 248,709,873 \) & \( 281,421,906 \) & \( 308,745,538 \) \\
\hline
\end{tabular}
Estimate the US population at year 2006,
(0) using linear splines,
(2) using \( p_{2}(x) \) that interpolates the population of US at the data points \( x_{0}=1990, x_{1}=2000 \) and \( x_{2}=2010 \).