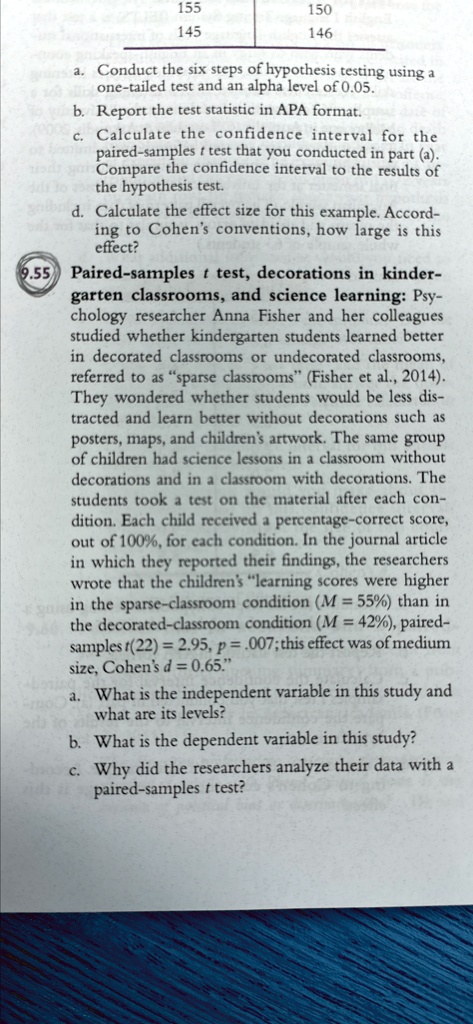
155
145
a. Conduct the six steps of hypothesis testing using a
one-tailed test and an alpha level of 0.05.
b. Report the test statistic in APA format.
c. Calculate the confidence interval for the
paired-samples $t$ test that you conducted in part (a).
Compare the confidence interval to the results of
the hypothesis test.
d. Calculate the effect size for this example. Accord-
ing to Cohen's conventions, how large is this
effect?
9.55 Paired-samples $t$ test, decorations in kinder-
garten classrooms, and science learning: Psy-
chology researcher Anna Fisher and her colleagues
studied whether kindergarten students learned better
in decorated classrooms or undecorated classrooms,
referred to as \"sparse classrooms\" (Fisher et al., 2014).
They wondered whether students would be less dis-
tracted and learn better without decorations such as
posters, maps, and children's artwork. The same group
of children had science lessons in a classroom without
decorations and in a classroom with decorations. The
students took a test on the material after each con-
dition. Each child received a percentage-correct score,
out of 100%, for each condition. In the journal article
in which they reported their findings, the researchers
wrote that the children's \"learning scores were higher
in the sparse-classroom condition ($M$ = 55%) than in
the decorated-classroom condition ($M$ = 42%), paired-
samples $t$(22) = 2.95, $p$ = .007; this effect was of medium
size, Cohen's $d$ = 0.65.\"
a. What is the independent variable in this study and
what are its levels?
b. What is the dependent variable in this study?
c. Why did the researchers analyze their data with a
paired-samples $t$ test?
150
146