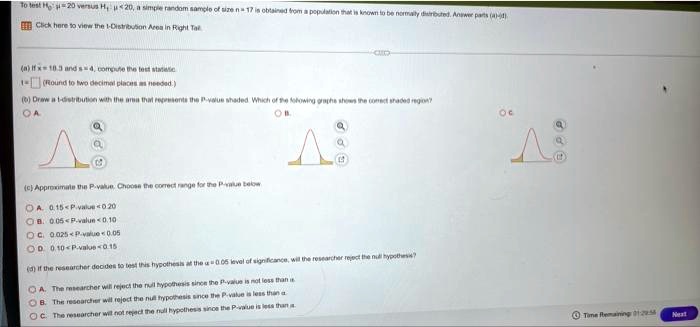
To test $H_0: \mu = 20$ versus $H_1: \mu < 20$, a simple random sample of size $n = 17$ is obtained from a population that is known to be normally distributed. Answer parts (a)-(d)
Click here to view the $t$-Distribution Area in Right Tail
(a) If $\bar{x} = 18.3$ and $s = 4$, compute the test statistic.
$t = \boxed{}
$(Round to two decimal places as needed.)
(b) Draw a $t$-distribution with the area that represents the $P$-value shaded. Which of the following graphs shows the correct shaded region?
(c) Approximate the $P$-value. Choose the correct range for the $P$-value below
A. $0.15 < P\text{-value} < 0.20$
B. $0.05 < P\text{-value} < 0.10$
C. $0.025 < P\text{-value} < 0.05$
D. $0.10 < P\text{-value} < 0.15$
(d) If the researcher decides to test this hypothesis at the $\alpha = 0.05$ level of significance, will the researcher reject the null hypothesis?
A. The researcher will reject the null hypothesis since the $P$-value is not less than $\alpha$.
B. The researcher will reject the null hypothesis since the $P$-value is less than $\alpha$.
C. The researcher will not reject the null hypothesis since the $P$-value is less than $\alpha$.