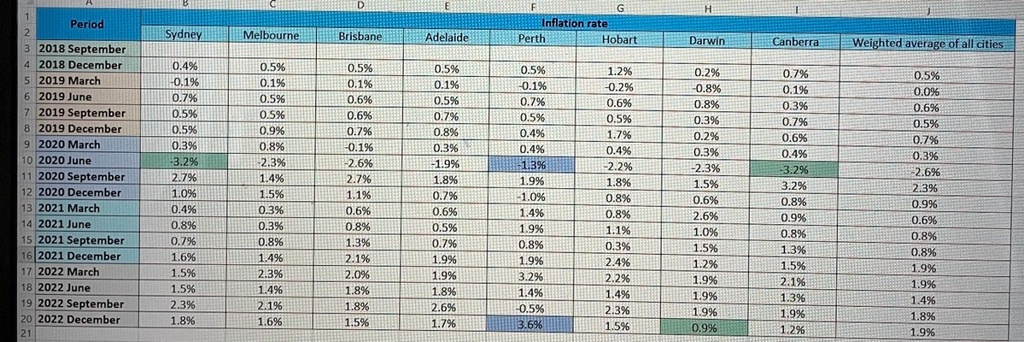
Reflect on the cities with high inflation rates and low inflation rates in Dec 2022 as compared to June 2020 and September 2018. What could be the driving factors for high inflation rates in recent times (end of 2022 and beginning of 2023)? Guide in answering question: - Discuss some possible reasons for inflation- demand pull? Cosh push? Or both? Why? -Do research to support your answers. (e.g., news reports, conversation piece, official reports etc.) to add to your explanations. Include proper citations for your research.
D
IF inflation rate Perth Hobart
H
Period
Sydney
Melbourne
Brisbane
2018 September 2018 December 52019 March 62019 June 7 2019 September 82019 December 92020 March 102020 June 112020 September 122020 December 132021March 142021 June 152021 September 162021December 172022 March 182022June 192022 September 202022 December 21
Adelaide
Darwin
Canberra
Weighted average of all cities
0.4% 0.1% 0.7% 0.5% 0.5% 0.3% 3.2% 2.7% 1.0% 0.4% 0.8% 0.7% 1.6% 1.5% 1.5% 2.3% 1.8%
0.5% 0.1% 0.5% 0.5% 0.9% %8'0 2.3% 1.4% 1.5% 0.3% 0.3% 0.8% 1.4% 2.3% .4% 2.1% 1.6%
0.5% 0.1% 0.6% 0.6% 0.7% 0.1% 2.6% 2.7% 1.1% 0.6% 0.8% 1.3% 2.1% 2.0% 1.8% 1.8% 1.5%
0.5% 0.1% 0.5% 0.7% 0.8% 0.3% -1.9% 1.8% 0.7% 0.6% 0.5% 0.7.9 1.9% 1.9% 1.8% 2.6% 1.7%
0.5% 0.1% 0.7% 0.5% 0.4% 0.4% 1.3% 1.9% 1.0% 1.4% 1.9% 0.8% 1.9% 3.2% 1.4% 0.5% 3.6%
1.2% 0.2% 0.6% 0.5% 1.7% 0.4% -2.2% 1.8% 0.8% 0.8% 1.1% 0.3% 2.4% 2.2% 1.4% 2.3% 1.5%
0.2% -0.8% 0.8% 0.3% 0.2% 0.3% 2.3% .5% 0.6% 2.6% 1.0% 1.5% .2% 1.9% 1.9% 1.9% 0.9%
0.7% 0.1% 0.3% 0.7% 0.6% 0.4% 3.2% 3.2% 0.8% 0.9% 0.8% 1.3% 1.5% 2.1% 1.3% 1.9% 2%
0.5% 0.0% 0.6% 0.5% 0.7% 0.3% 2.6% 2.3% 0.9% 0.6% %80 0.8% 1.9% 1.9% 1.4% 1.8% 1.9%