library (okcupiddata)
library (dplyr)
data ("profiles")
profiles1 <- profiles %>%
filter (is.na(income) == FALSE, is.na(drinks) == FALSE) %>%
mutate (income.thous = income/10^3,
income.cat = ifelse (income.thous <= 100, "100k or Less",
ifelse (income.thous <= 500, "100k to 500k",
"More than 500k")))
Also, note that income is converted into thousands of dollars, and that a categorical variable for
income is created using the `ifelse` command. This splits users into one of three categories based on
their incomes.
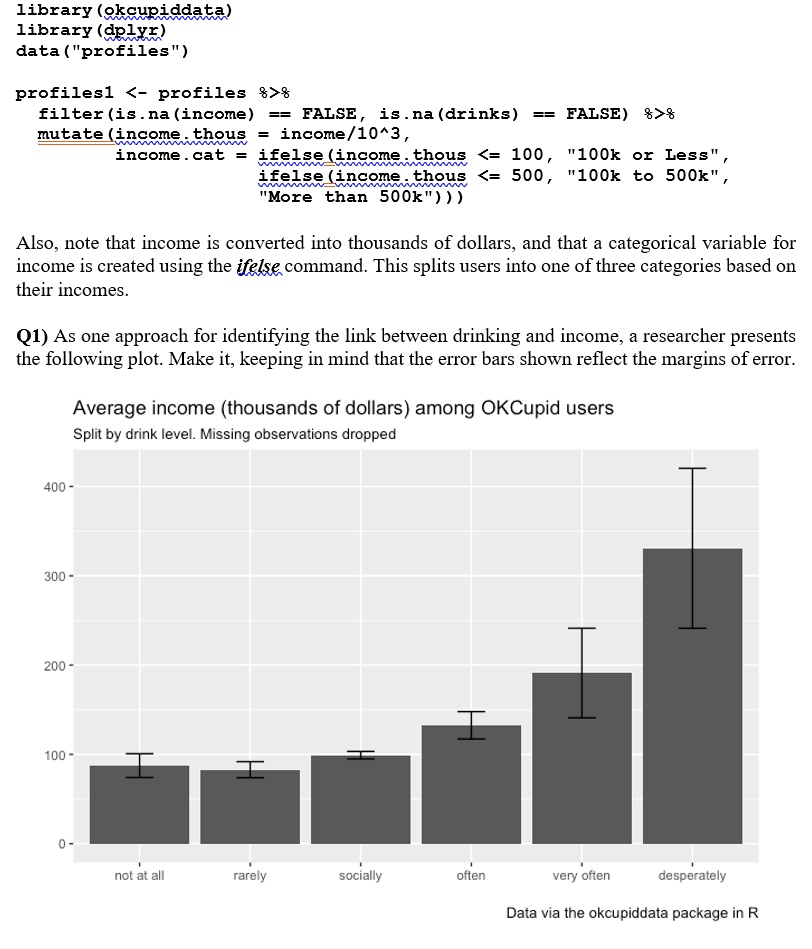
Q1) As one approach for identifying the link between drinking and income, a researcher presents
the following plot. Make it, keeping in mind that the error bars shown reflect the margins of error.
Average income (thousands of dollars) among OKCupid users
Split by drink level. Missing observations dropped