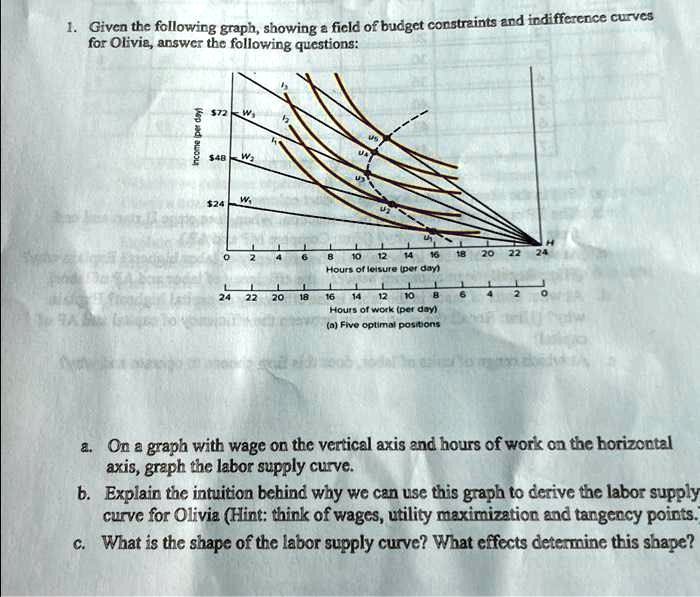
1. Given the following graph, showing a field of budget constraints and indifference curves
for Olivia, answer the following questions:
Income (per day)
$72
W3
$48
W2
$24
W1
0
2
4
6
8
10
12
14
16
18
20
22
24
H
24
22
20
18
16
14
12
10
8
6
4
2
0
Hours of leisure (per day)
Hours of work (per day)
(a) Five optimal positions
a. On a graph with wage on the vertical axis and hours of work on the horizontal
axis, graph the labor supply curve.
b. Explain the intuition behind why we can use this graph to derive the labor supply
curve for Olivia (Hint: think of wages, utility maximization and tangency points.
c. What is the shape of the labor supply curve? What effects determine this shape?