E17-20 Analyzing profitability
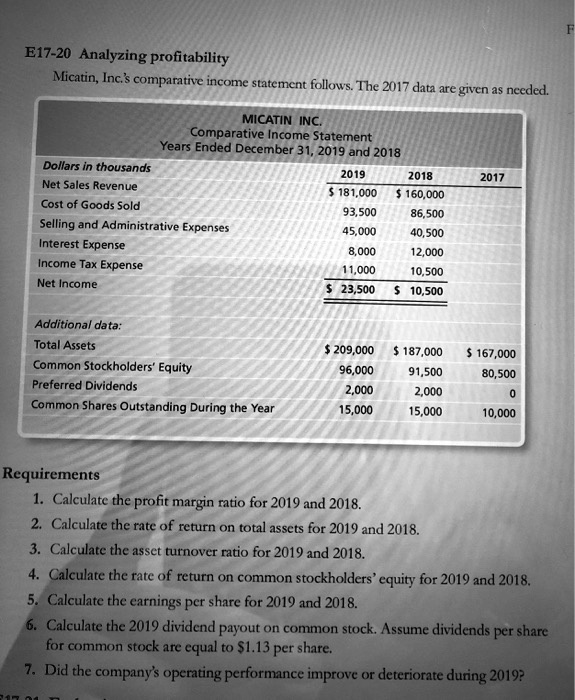
Micatin, Inc.'s comparative income statement follows. The 2017 data are given as needed.
MICATIN INC.
Comparative Income Statement
Years Ended December 31, 2019 and 2018
Dollars in thousands
Net Sales Revenue
Cost of Goods Sold
Selling and Administrative Expenses
Interest Expense
Income Tax Expense
Net Income
2019
2018
2017
$ 181,000
$ 160,000
93,500
86,500
45,000
40,500
8,000
12,000
11,000
10,500
$ 23,500 $ 10,500
Additional data:
Total Assets
$ 209,000 $ 187,000
$ 167,000
Common Stockholders' Equity
96,000
91,500
80,500
Preferred Dividends
2,000
2,000
0
Common Shares Outstanding During the Year
15,000
15,000
10,000
Requirements
1. Calculate the profit margin ratio for 2019 and 2018.
2. Calculate the rate of return on total assets for 2019 and 2018.
3. Calculate the asset turnover ratio for 2019 and 2018.
4. Calculate the rate of return on common stockholders' equity for 2019 and 2018.
5. Calculate the earnings per share for 2019 and 2018.
6. Calculate the 2019 dividend payout on common stock. Assume dividends per share
for common stock are equal to $1.13 per share.
7. Did the company's operating performance improve or deteriorate during 2019?
F