Texts: help me
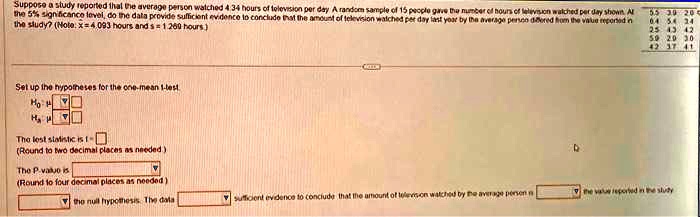
Suppose a study reported that the average person watched 434 hours of television per day. A random sample of 15 people gave the number of hours of television watched per day shown in the table below. At the 5% significance level, does the data provide sufficient evidence to conclude that the amount of television watched by the average person is different from 4093 hours (s=1.260 hours)?
Set up the hypotheses for the one-mean test:
H0: The true population mean is equal to 4093 hours.
Ha: The true population mean is not equal to 4093 hours.
Calculate the test statistic (Round to two decimal places as needed):
The test statistic is calculated using the formula: t = (x̄ - μ) / (s / √n), where x̄ is the sample mean, μ is the hypothesized population mean, s is the sample standard deviation, and n is the sample size.
Calculate the p-value (Round to four decimal places as needed):
The p-value is the probability of observing a test statistic as extreme as the one calculated, assuming the null hypothesis is true.
Based on the p-value, determine if there is sufficient evidence to conclude that the amount of television watched by the average person is different from 4093 hours.