Please zoom in on the image since Chegg no longer allows for more than one image. Please provide sample code with matching outputs and passing test cases. I will provide the files below so you can see them, please use those and explain how to convert to CSV. Thank you!
Please look up the files; they should pop up as it is not letting me upload them here.
Rest of instructions:
Does it follow the law?
The other thing you should determine is if the data follows Benford’s Law. For the purposes of this PA, a data set will follow Benford’s law if the percentage of occurrences of each digit follows the following percentages, plus 10% or minus 5%.
digit percent (-5, +10)
1 30%
2 17%
3 12%
4 9%
5 7%
6 6%
7 5%
8 5%
9 4%
list_of_numbers = csv_to_list("places.csv")
assert list_of_numbers == ["1234", "145", "10", "1700", "1729", "1711", "219", "231", "20001", "301", "3879", "404", "40123", "505", "502", "601", "712", "81231", "91231"]
counts = count_start_digits(list_of_numbers)
percentages = digit_percentages(counts)
assert check_benfords_law(percentages) == True
Test cases:
populations.csv does follow Benford’s Law
stocks.csv does follow Benford’s Law
random_numbers.csv does NOT follow Benford’s Law
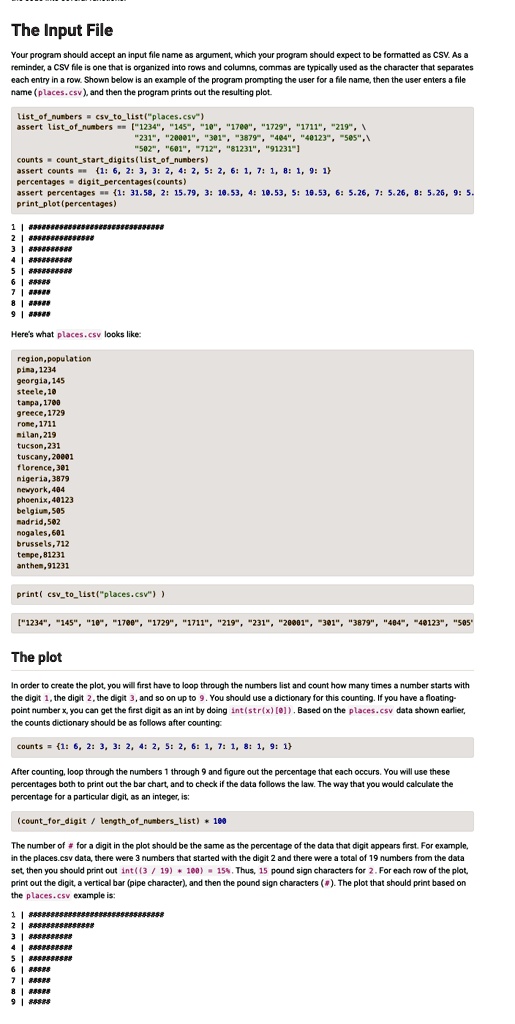
The Input File:
Your program should accept an input file name as an argument, which your program should expect to be formatted as CSV. Each entry in a row. Shown below is an example of the program prompting the user for a file name, then the user enters a file name (places.csv), and then the program prints out the resulting plot.
List_of_numbers = csv_to_list("places.csv) assert list_of_numbers = ["1234", "145", "1, 178e, "1729", "1711", "219, ...
counts = count_start_digits(list_of_numbers) assert counts mm{1:6,2:3,3:2,4:2,5:2,6:1,7:1,8:1,9:1} percentages = digit_percentages(counts) print_plot(percentages)
Here's what places.csv looks like:
regionpopulation pima,1234 georgia,145 steele,10 tanpa,1700 greece,1729 rome,1711 milan,219 tucson,231 tuscany,20001 florence,301 nigeria,3879 newyork,484 phoenix,40123 belgium,505 madrid,582 nogales,601 brussels,712 tempe,81231 anthem,91231
print(csv_to_list("places.csv"))
"1234"45"170"1729"171119"31"2003"387944123505
The plot:
In order to create the plot, you will first have to loop through the numbers list and count how many times a number starts with the digit 1, the digit 2, the digit 3, and so on up to 9. You should use a dictionary for this counting. If you have a floating-point number, the counts dictionary should be as follows after counting:
counts = {1:6,2:3,3:2,4:2,5:2,6:1,7:1,8:1,9:1}
After counting, loop through the numbers 1 through 9 and figure out the percentage that each occurs. You will use these percentages both to print out the bar chart and to check if the data follows the law. The way that you would calculate the percentage for a particular digit, as an integer, is:
(count_for_digit / length_of_numbers_List) * 100
The number of # for a digit in the plot should be the same as the percentage of the data that digit appears first. For example, in the places.csv data, there were 3 numbers that started with the digit 2 and there were a total of 19 numbers from the data set, then you should print out int(3/19 * 100) = 15. Thus, 15 pound sign characters for 2. For each row of the plot, the places.csv example is:
3|8888 4|8858888588
6|85 7|88588 8| 9 188588