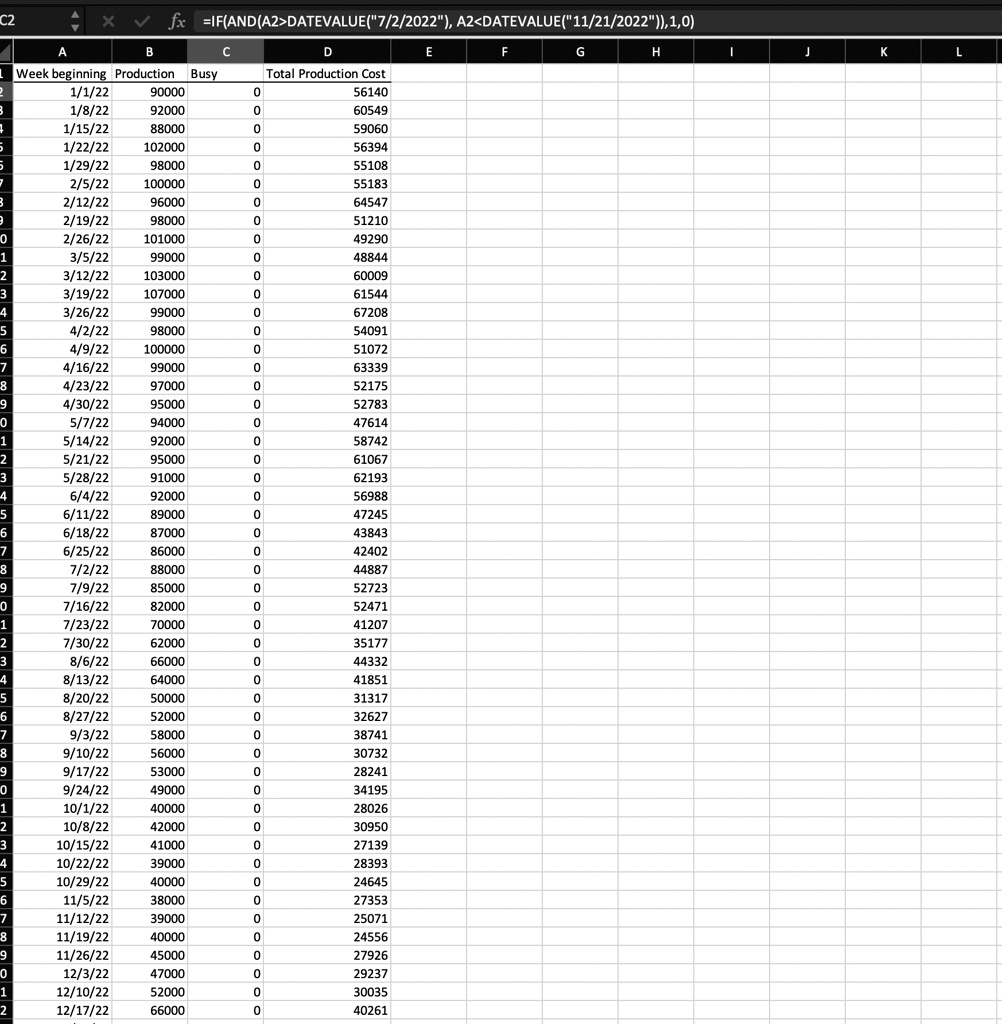
(1)/(1)/22To estimate the cost behavior for AERT, we will run basic regression analysis. To prepare the data, we need to insert a “1” in the cells that correspond to busy season and a “0” in the cells that correspond to the off-busy season. Since the product sells primarily in the spring and summer, they build up their inventory from the beginning of the year through the first part of June.
To do this, in column “C”, starting with cell C2, we insert a 1 for those weeks from the beginning of the year until (and including) 6/4/2022. We insert a “0” (zero) for those weeks starting 6/11/2022 until the end of the year. We will assume we have a huge amount of data, so we will use an excel formula to do this. Note that “if” statements in excel that use dates as the logical qualifier, must use a DATEVALUE function, like this: =IF(A2(1)/(1)/22,90000,0,56140],[1/8/22,92000,0,60549],[(1)/(15)/22,88000,0,59060],[(1)/(22)/22,102000,0,56394],[(1)/(29)/22,98000,0,55108],[(2)/(5)/22,100000,0,55183],[(2)/(12)/22,96000,0,64547],[(2)/(19)/22,98000,0,51210],[(2)/(26)/22,101000,0,49290],[(3)/(5)/22,99000,0,48844],[(3)/(12)/22,103000,0,60009],[(3)/(19)/22,107000,0,61544],[(3)/(26)/22,99000,0,67208],[(4)/(2)/22,98000,0,54091],[(4)/(9)/22,100000,0,51072],[(4)/(16)/22,99000,0,63339],[(4)/(23)/22,97000,0,52175],[(4)/(30)/22,95000,0,52783],[(5)/(7)/22,94000,0,47614],[(5)/(14)/22,92000,0,58742],[(5)/(21)/22,95000,0,61067],[(5)/(28)/22,91000,0,62193],[(6)/(4)/22,92000,0,56988],[(6)/(11)/22,89000,0,47245],[(6)/(18)/22,87000,0,43843],[(6)/(25)/22,86000,0,42402],[(7)/(2)/22,88000,0,44887],[(7)/(9)/22,85000,0,52723],[(7)/(16)/22,82000,0,52471],[(7)/(23)/22,70000,0,41207],[(7)/(30)/22,62000,0,35177],[8/6/22,66000,0,44332],[(8)/(13)/22,64000,0,41851],[(8)/(20)/22,50000,0,31317],[(8)/(27)/22,52000,0,32627],[9/3/22,58000,0,38741],[9/10/22,56000,0,30732],[9/17/22,53000,0,28241],[(9)/(24)/22,49000,0,34195],[10/1/22,40000,0,28026],[(10)/(8)/22,42000,0,30950],[10/15/22,41000,0,27139],[(10)/(22)/22,39000,0,28393],[10/29/22,40000,0,24645],[(11)/(5)/22,38000,0,27353],[11/12/22,39000,0,25071],[(11)/(19)/22,40000,0,24556],[(11)/(26)/22,45000,0,27926],[(12)/(3)/22,47000,0,29237],[(12)/(10)/22,52000,0,30035],[(12)/(17)/22,66000,0,40261]]
C2
X
fx
A
B
C Week beginning Production Busy 1/1/22 90000 1/8/22 92000 1/15/22 88000 1/22/22 102000 1/29/22 98000 2/5/22 100000 2/12/22 96000 2/19/22 98000 2/26/22 101000 3/5/22 99000 3/12/22 103000 3/19/22 107000 3/26/22 99000 4/2/22 98000 4/9/22 100000 4/16/22 99000 4/23/22 97000 4/30/22 95000 5/7/22 94000 5/14/22 92000 5/21/22 95000 5/28/22 91000 6/4/22 92000 6/11/22 89000 6/18/22 87000 6/25/22 86000 7/2/22 88000 7/9/22 85000 7/16/22 82000 7/23/22 70000 7/30/22 62000 8/6/22 66000 8/13/22 64000 8/20/22 50000 8/27/22 52000 9/3/22 58000 9/10/22 56000 9/17/22 53000 9/24/22 49000 10/1/22 40000 10/8/22 42000 10/15/22 41000 10/22/22 39000 10/29/22 40000 11/5/22 38000 11/12/22 39000 11/19/22 40000 11/26/22 45000 12/3/22 47000 12/10/22 52000 12/17/22 66000
D
G
H
Total Production Cost 0 56140 0 60549 0 59060 0 56394 0 55108 0 55183 0 64547 0 51210 0 49290 0 48844 0 60009 0 61544 0 67208 0 54091 0 51072 0 63339 0 52175 0 52783 0 47614 0 58742 0 61067 0 62193 0 56988 0 47245 0 43843 0 42402 0 44887 0 52723 0 52471 0 41207 0 35177 0 44332 0 41851 0 31317 0 32627 0 38741 0 30732 0 28241 0 34195 0 28026 0 30950 0 27139 0 28393 0 24645 0 27353 0 25071 0 24556 0 27926 0 29237 0 0 40261