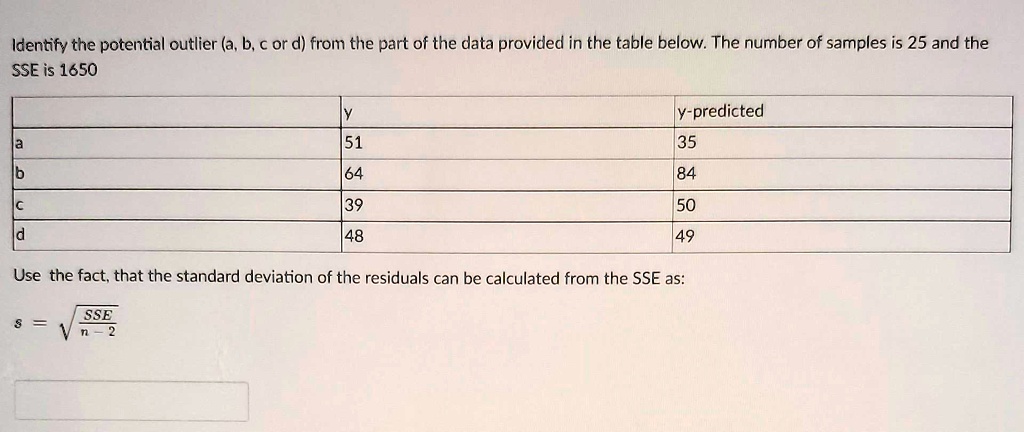
Identify the potential outlier (a, b, c or d) from the part of the data provided in the table below. The number of samples is 25 and the SSE is 1650
a
b
c
d
y
51
64
39
48
y-predicted
35
84
50
49
Use the fact, that the standard deviation of the residuals can be calculated from the SSE as:
$s = \sqrt{\frac{SSE}{n - 2}}$