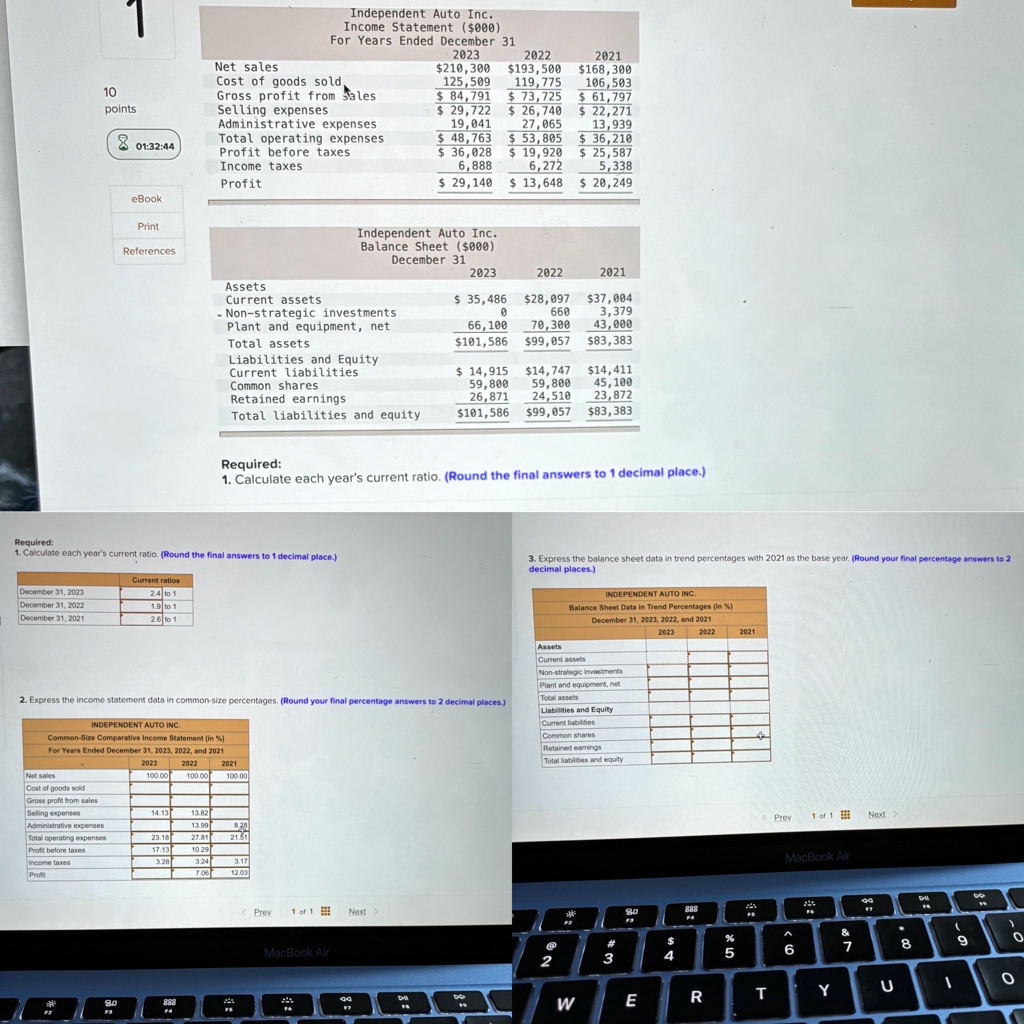
Required: Calculate each year's current ratio. (Round the final answers to 1 decimal place.)
Required: Calculate each year's current ratio. (Round the final answers to 1 decimal place.)
able[[,Current ratios,],[December 31, 2023,2.4,to 1],[December 31, 2022,1.9,to 1],[December 31, 2021,2.6,to 1]]
Express the income statement data in common-size percentages. (Round your final percentage answers to 2 decimal places.)
able[[INDEPENDENT AUTO INC.],[Common-Size Comparative Income Statement (in %),,],[For Years Ended December 31,2023,2022, and 2021,,],[,2023,2022,2021,],[Net sales,100.00,100.00,100.00,],[Cost of goods sold,,,,],[Gross profit from sales,,,,],[Selling expenses,14.13,13.82,,],[Administrative expenses,,13.99,8.28,],[Total operating expenses,23.18,27.81,21.51,],[Profit before taxes,17.13,10.29,,],[Income taxes,3.28,3.24,3.17,],[Profit,,7.06,12.03,]]
Express the balance sheet data in trend percentages with 2021 as the base year. (Round your final percentage answers to 2 decimal places.)
able[[INDEPENDENT AUTO INC.,],[Balance Sheet Data in Trend Percentages (in %),],[December 31, 2023, 2022, and 2021,],[,2023,2022,2021],[Assets,,,],[Current assets,,,],[Non-strategic investments,,,],[Plant and equipment, net,,,],[Total assets,,,],[Liabilities and Equity,,,],[Current liabilities,,,],[Common shares,,,],[Retained earnings,,,],[Total liabilities and equity,,,]]
Independent Auto Inc. Income Statement $000 For Years Ended December 31 2023 2022 2021 Net sales $210,300 $193,500 $168,300 Cost of goods sold $125,509 $119,775 $106,503 Gross profit from Sales $84,791 $73,725 $61,797 Selling expenses $29,722 $26,740 $22,271 Administrative expenses $19,041 $27,065 $13,939 Total operating expenses $48,763 $53,805 $36,210 Profit before taxes $36,028 $19,920 $25,587 Income taxes $6,888 $6,272 $5,338 Profit $29,140 $13,648 $20,249
10 points
01:32:44
eBook
Print
Independent Auto Inc. Balance Sheet ($000) December 31 2023
References
2022
2021
Assets Current assets -Non-strategic investments Plant and equipment, net Total assets Liabilities and Equity Current liabilities Common shares Retained earnings Total liabilities and equity
$35,486 0 66,100 $101,586
$28,097 $37,004 660 3,379 70,300 43,000 $99,057 $83,383
$14,915 $14,747 $14,411 59,800 59,800 45,100 26,871 24,510 23,872 $101,586 $99,057 $83,383
Required: 1.Calculate each year's current ratio. Round the final answers to 1 decimal place.)
Required: 1. Calculate each year's current ratio. (Round the final answers to 1 decimal place.)
3.Express the balance sheet data in trend percentages with 2021 as the base year. (Round your final percentage answers to 2 decimal places.)
December 31, 2023
2.4 to 1 1.9 to
INDEPENDENT AUTO INC
Balance Sheet Data in Trend Percentages (in % December 31, 2023, 2022, and 2021 2023 2022 2021 Assets Current assets Non-strategic investments Plant and equipment, net
ber 31, 2021
2.6 to
2.Express the income statement data in common-size percentages. (Round your final percentas
ties and Equity
INDEPENDENT AUTO INC
Common-Size Comparative Income Statement (in %) For Years Ended December 31,2023,2022, and 2021 2023 2022 2021 Net sales 100.00 100.00 100.00 Cost of goods sold Gross profit from sales 14.13 13.82 Administrative expenses 13.99 8.28 Total operating expenses 23.18 27.81 21.51 Profit before taxes 17.13 10.29 3.28 3.24 3.17 Profit
uned earnings
Prev
1 of 1
Next
MacBook Air
2:
Prey
1 Next
888
6 4
5
# 3
8
MacBook Air
@
2
W
E
R
T