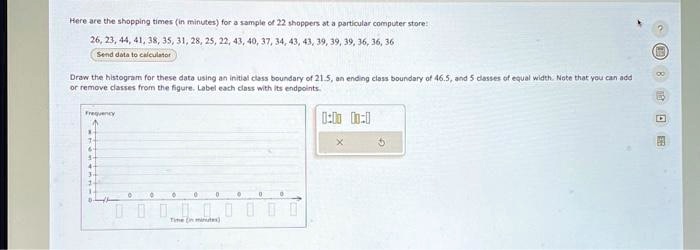
Here are the shopping times (in minutes) for a sample of 22 shoppers at a particular computer store:
26, 23, 44, 41, 38, 35, 31, 28, 25, 22, 43, 40, 37, 34, 43, 43, 39, 39, 39, 36, 36, 36
Send data to calculator
Draw the histogram for these data using an initial class boundary of 21.5, an ending class boundary of 46.5, and 5 classes of equal width. Note that you can add
or remove classes from the figure. Label each class with its endpoints.
Frequency
6-
5-
4-
3-
2-
1-
0
0 0
0 0 0 0 0
Time (in minutes)