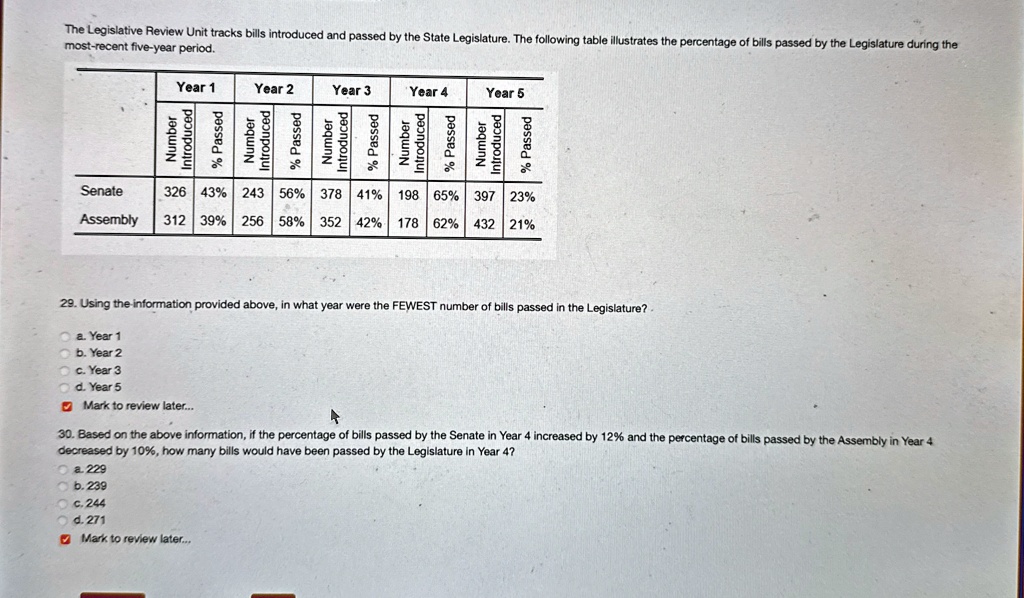
The Legislative Review Unit tracks bills introduced and passed by the State Legislature. The following table illustrates the percentage of bills passed by the Legislature during the most-recent five-year period.
Year 1 Year 2 Year 3 Year 4 Year 5
Number % Number % Number % Number % Number %
Introduced Passed Introduced Passed Introduced Passed Introduced Passed Introduced Passed
Senate 326 43% 243 56% 378 41% 198 65% 397 23%
Assembly 312 39% 256 58% 352 42% 178 62% 432 21%
29. Using the information provided above, in what year were the FEWEST number of bills passed in the Legislature?
a. Year 1
b. Year 2
c. Year 3
d. Year 5
30. Based on the above information, if the percentage of bills passed by the Senate in Year 4 increased by 12% and the percentage of bills passed by the Assembly in Year 4 decreased by 10%, how many bills would have been passed by the Legislature in Year 4?
a. 229
b. 239
c. 244
d. 271