Ace - AI Tutor
Ask Our Educators
Textbooks
My Library
Flashcards
Scribe - AI Notes
Notes & Exams
Download App
eugenia valentine

eugenia v.

Divider

Questions asked

BEST MATCH

Discuss the limitations of measuring stressful events by asking people to merely identify and quantify those events.

View Answer
divider
BEST MATCH

Compute the number of liters (L) in 8.90 gallons, given that one gallon is exactly 231 cubic inches.

View Answer
divider
BEST MATCH

Metal Ion for Analysis Co A. A Set of Standard Solutions molecular weight = 291.051 1. Prepare a stock solution. Show the calculation for the mass of metal ion salt in the preparation of the stock solution. See Prelaboratory Assignment, question 2a. 100ML\times\frac{10^{-1}L}{100mL}\times\frac{0.10mol}{1L}\times\frac{58.9332g}{1mol} = 2.91g Measured tared mass of metal ion salt (g) 2.918 g\times\frac{1mol}{58.9332g} = 0.04951mol\times\frac{1L}{10^{-1}L} = 0.4951M Describe the preparation of the 0.10 M stock solution. Concentration of stock solution (mol/L) 0.4951M B. Determination of $\lambda_{max}$ 2. Wavelength scan. Use the following table to record wavelength and absorbance data. $\lambda$ Abs $\lambda$ Abs $\lambda$ Abs $\lambda$ Abs $\lambda$ Abs $\lambda$ Abs $\lambda$ Abs 514.9 0.018 516.2 0.046 511.24 0.084 513.0 0.238 498.8 0.354 5130 0.462 516.2 0.052 2 3 4 blunk Plot the data of absorbance versus wavelength to set $\lambda_{max}$. From the data plot, $\lambda_{max} = 50520$ unknown nm Have the instructor approve your graph. C. Plot the Calibration Curve 1. Absorbance of standard solutions. Read and record the absorbance values for the standard solutions. Standard Solution Volume of Standard Absorbance Calculated Molar Solution (mL) Concentration Blank 0 0.019 1 1 0.046 2 5 0.084 3 10 0.238 4 15 0.354 5 20 0.462 others as needed

View Answer
divider
BEST MATCH

A bank balance sheet is called the ___ OT Account, assets O K Account, assets OT Account, liabilities OK Account, liabilities account where deposits are

View Answer
divider
BEST MATCH

(Solow model) Consider a modified version of the discrete-time Solow growth model where the aggregate production function is Y=F(K,AL)=(K)(AL)^(1-a) where K is physical capital, A denotes the effectiveness of labor and AL is the efficiency units of labor (physical labor stock is still L). Function F(.) is strictly concave and the same assumptions that we made in class apply to this production function. Suppose that A is a neutral technology process and grows at a constant rate g, that is A=1 +gAt-1. The labor input L grows at a constant rate n, that is L=1+nLt-1. The physical capital depreciates at the rate δ, and there is an exogenous savings rate of s. The capital accumulation process is K+1=(1-δ)K+It and It=sYt. (a) Write down the production function in per effective labor. (b) Show that the per effective labor production function satisfies the properties of a neoclassical production function [Check your notes for the properties of a neoclassical production function.]. (c) Write down the capital accumulation equation in terms of per effective labor variables. (d) Show that the dynamic capital accumulation equation is: (1+g+n)(kt+1-kt)=sk-(δ+g+n)kt. (e) Find the steady state capital, output, and consumption. (f) Show in a Solow Diagram how the economy converges to the steady-state. (g) Suppose that there is a technological innovation and the constant growth rate of technology increased to g. What will happen to the steady-state equilibrium? Show it on a new Solow diagram. Discuss the effects. (h) Calculate the golden rule of capital. (i) Calculate the growth rate of capital. Assume that the parameter values of the economy are as follows: s = 0.4, n = 2%, g = 5%, α = 0.5, δ = 0.1. (j) Recalculate the steady-state value of capital with the given parameter values. (k) Now compare two economies with different initial capital stocks. The poor country A has ko = 0.8k* and the rich country B has ko = 1.2k*. Using the given information, draw the Solow chart (now you should use EXCEL or MATLAB) for both economies and discuss your findings. (l) Compare the growth rates of capital for both economies. Discuss. (m) What did you learn from the Solow model? Briefly explain.

View Answer
divider
BEST MATCH

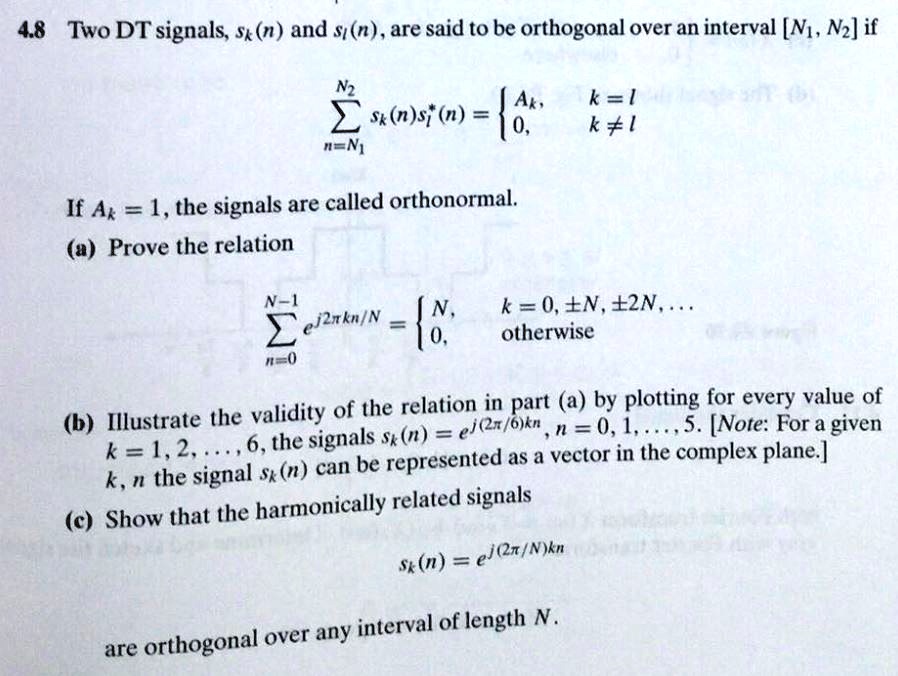
4.8 Two DT signals, $s_k(n)$ and $s_l(n)$, are said to be orthogonal over an interval $[N_1, N_2]$ if \begin{equation} \sum_{n=N_1}^{N_2} s_k(n)s_l^*(n) = \begin{cases} A_k, & k=l\\0, & k \neq l\end{cases} \end{equation} If $A_k = 1$, the signals are called orthonormal. (a) Prove the relation \begin{equation} \sum_{n=0}^{N-1} e^{j2\pi kn/N} = \begin{cases} N, & k = 0, \pm N, \pm 2N, ...\\0, & \text{otherwise}\end{cases} \end{equation} (b) Illustrate the validity of the relation in part (a) by plotting for every value of $k = 1, 2, ..., 6$, the signals $s_k(n) = e^{j(2\pi/6)kn}$, $n = 0, 1, ..., 5$. [Note: For a given k, n the signal $s_k(n)$ can be represented as a vector in the complex plane.] (c) Show that the harmonically related signals $s_k(n) = e^{j(2\pi/N)kn}$ are orthogonal over any interval of length N.
View Answer
divider
BEST MATCH

2. Computing Price Elasticities and Optimal Prices You have been hired as a pricing consultant for a grocery store chain that is well known for the quality of its store brand products. The chain wants to better understand the pricing and positioning of its store brand fruit juice, which has two major branded competitors. They have given you about four years' worth of data on weekly prices and sales of the three brands of juice: Tropicana, Minute Maid, and a private-label store brand. A full description of the data is included below, after the assignment questions. To answer the questions below, run the following simple linear regression: $Q_i = \beta_0 + \beta_1 p_i + e_i$ You should run a separate regression for each brand. In this regression equation, $Q_i$ (ounces sold) is the dependent variable, $p_i$ (price) is the regressor, and $u_i$ represents the residual (or prediction error) term. $\beta_0$ and $\beta_1$ are the intercept and the slope parameters, respectively. Questions: 1. Using the regression results, compute own-price elasticity of sales at (average P, average Q) for each brand. Price elasticity, $\epsilon$, can be expressed as: $\epsilon = \frac{\partial Q}{\partial p} \frac{p}{Q}$ where $\beta_1$ is the slope coefficient estimated from each brand's regression, and should be replaced with each brand's ratio of the sample average price to the sample average quantity.

View Answer
divider
BEST MATCH

Question 13 of 18 View Policies Show Attempt History Current Attempt in Progress Your answer is incorrect. Swifty Corporation purchased a piece of equipment for $74,900. It estimated a 8-year life and a $2,900 salvage value. At the end of year four (before the depreciation adjustment), it estimated the new total life to be 10 years and the new salvage value to be $8,000. Compute the revised depreciation assuming Swifty uses the straight-line method. Revised annual depreciation $ 1 eTextbook and Media Save for Later Using multiple attempts will impact your score. 10% score reduction after attempt 5 Attempts: unlimited Submit Answer

View Answer
divider
BEST MATCH

Question 3 Correct Mark 3.00 out of 3.00 Flag question The following loop displays _________ int i=2; for (;;){ printf("%d ",i); if((i+=2)==10) return; } Select one: a. The program runs in an infinite loop. b. The program has a compile error because the control variable in the for loop cannot be of the double type. c. The program has a compile error because the adjustment is missing in the for loop. d. The program compiles and runs fine. The correct answer is: The program compiles and runs fine.

View Answer
divider
BEST MATCH

Consider a situation where a microscope is available to make observations on a fairly small object. What color of visible light would give the best resolution in the microscope? Explain with a reasoned basis and put the references

View Answer
divider