Ace - AI Tutor
Ask Our Educators
Textbooks
My Library
Flashcards
Scribe - AI Notes
Notes & Exams
Download App
f-tima espinoza

f-tima e.

Divider

Questions asked

BEST MATCH

What sysinternals tool will show you information about all TCP and UDP endpoints (sockets) on your system?

View Answer
divider
BEST MATCH

what are two alternative personality theories that challenge the validity, weaknesses, or biases of feminist psychology?

View Answer
divider
BEST MATCH

consumer has $400 to spend on goods X and Y. The market prices of these two goods arePx = $12 and Py = $8. If the income of the consumer increases to $500, what is the market rateof substitution of goods X and

View Answer
divider
BEST MATCH

A certain C$_2$H$_3$Cl$_3$ isomer is characterized by a $^1$H NMR spectrum that consists of only a single peak with a chemical shift of $\delta$ 2.7. Identify the compound. Select the single best answer. 1,2,3-Trichloropropane 1,1,2-Trichloroethene 1,1,1-Trichloroethane 1,1,2-Trichloroethane

View Answer
divider
BEST MATCH

The stall speed corrections for CG position and weight may be written, respectively, as: $$V_{Sc} = V_s \left[ \frac{l_t + \frac{5}{4} - \hat{x}_{cg,std} \times C}{l_t + \frac{5}{4} - \hat{x}_{cg,test} \times C} \right]^{1/2}$$ and $$V_{Sc,std} = V_s \sqrt{\frac{W_{std}}{W_{test}}}$$ Using the following aircraft data, * Maximum take-of mass = 1,865 kg * Wing area = 19 m² * Wingspan = 11 m * Tailplane moment arm = 2.6 m * Non-dimensional standard position of CG: $\hat{x}_{cg,std}$ = 0.25 * Non-dimensional test position of CG: $\hat{x}_{cg,test}$ = 0.36 determine the aircraft's corrected stall speed given that the indicated stall speed at a test weight of 1,418 kg was recorded as 145 knots. Give your answer in knots.

View Answer
divider
BEST MATCH

The processes of blood glucose regulation and red blood cell production which are facilitated by the release of hormones into the blood, are examples of what type of cell signaling? Intracrine Juxtacrine Autocrine Paracrine Endocrine

View Answer
divider
BEST MATCH

Moving to another question will save this response. Question 4 [CLO-1] The table below shows the scores of a group of students on a 10-point multiple-choice placement test. Exam Score 3 4 5 6 7 8 9 10 Frequency 5 3 5 2 7 6 1 2 The percentage of students who scored 5 on the test is • 30.4% • 8% • 18% • 16.12% Moving to another question will save this response. Question 4 of 25

View Answer
divider
BEST MATCH

Match the names of the microscope parts in column A with the descriptions in column B. Place the letter of your choice in the space provided. 1 Noseplece 2 Arm 3 Field of view 4 Eyepiece (ocular) 5 Stage (slide) clip Match each of the options above to the Items below. Holds a microscope slide in position Contains a lens at the top of the body tube Serves as a handle for carrying the microscope Part to which the objective lenses are attached Circular area seen through the eyeplece

View Answer
divider
BEST MATCH

The trade magazine OSR routinely checks the drive-through service times of fast-food restaurants. A 99% confidence interval that results from examining 720 customers in Taco Bell's drive-through has a lower bound of 169.0 seconds and an upper bound of 174.8 seconds. Complete parts (a) through (c) (a) What is the mean service time from the 720 customers? The mean service time from the 720 customers is 171.9 seconds (Type an integer or a decimal. Do not round.) (b) What is the margin of error for the confidence interval? The margin of error is seconds. (Type an integer or a decimal. Do not round.)

View Answer
divider
BEST MATCH

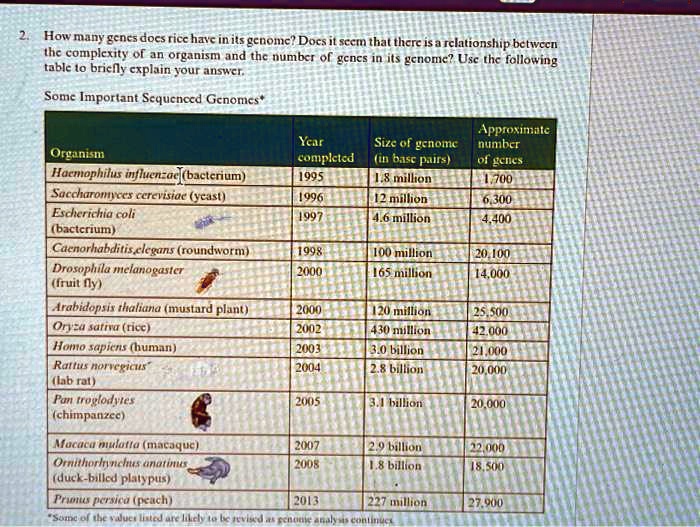
2. How many genes does rice have in its genome? Does it seem that there is a relationship between the complexity of an organism and the number of genes in its genome? Use the following table to briefly explain your answer. Some Important Sequenced Genomes* Year Size of genome Approximate number Organism completed (in base pairs) of genes Haemophilus influenzae (bacterium) 1995 1.8 million 1,700 Saccharomyces cerevisiae (yeast) 1996 12 million 6,300 Escherichia coli 1997 4.6 million 4,400 (bacterium) Caenorhabditis elegans (roundworm) 1998 100 million 20,100 Drosophila melanogaster 2000 165 million 14,000 (fruit fly) Arabidopsis thaliana (mustard plant) 2000 120 million 25,500 Oryza sativa (rice) 2002 430 million 42,000 Homo sapiens (human) 2003 3.0 billion 21,000 Rattus norvegicus 2004 2.8 billion 20,000 (lab rat) Pan troglodytes 2005 3.1 billion 20,000 (chimpanzee) Macaca mulatta (macaque) 2007 2.9 billion 22,000 Ornithorhynchus anatinus 2008 1.8 billion 18,500 (duck-billed platypus) Prunus persica (peach) 2013 227 million 27,900 *Some of the values listed are likely to be revised as genome analysis continues
View Answer
divider