Aplia: Student Question X
takeQuiz&quiz_probGuid=Q4PLC0AB010100000036203570080000&ctx=jhenzel-0051&ck=m_1520894452379_GAAA68040160E8BA22889A800000
part of the Quing with Jake's free-throw percentage for each game and his overall free-throw percentage after each game.
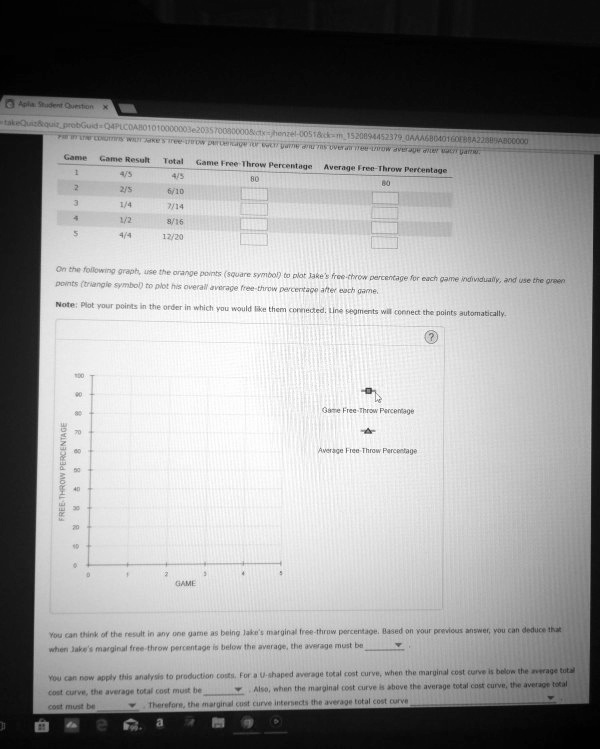
Game Game Result Total Game Free-Throw Percentage Average Free-Throw Percentage
1 4/5 4/5 80 80
2 2/5 6/10
3 1/4 7/14
4 1/2 8/16
5 4/4 12/20
On the following graph, use the orange points (square symbol) to plot Jake's free-throw percentage for each game individually, and use the green
points (triangle symbol) to plot his overall average free-throw percentage after each game.
Note: Plot your points in the order in which you would like them connected. Line segments will connect the points automatically.
FREE-THROW PERCENTAGE
100
90
80
70
60
50
40
30
20
10
0
0 1 2 3 4 5
GAME
Game Free-Throw Percentage
Average Free-Throw Percentage
You can think of the result in any one game as being Jake's marginal free-throw percentage. Based on your previous answer, you can deduce that
when Jake's marginal free-throw percentage is below the average, the average must be
?
You can now apply this analysis to production costs. For a U-shaped average total cost curve, when the marginal cost curve is below the average total
cost curve, the average total cost must be
?
Also, when the marginal cost curve is above the average total cost curve, the average total
cost must be
?
Therefore, the marginal cost curve intersects the average total cost curve