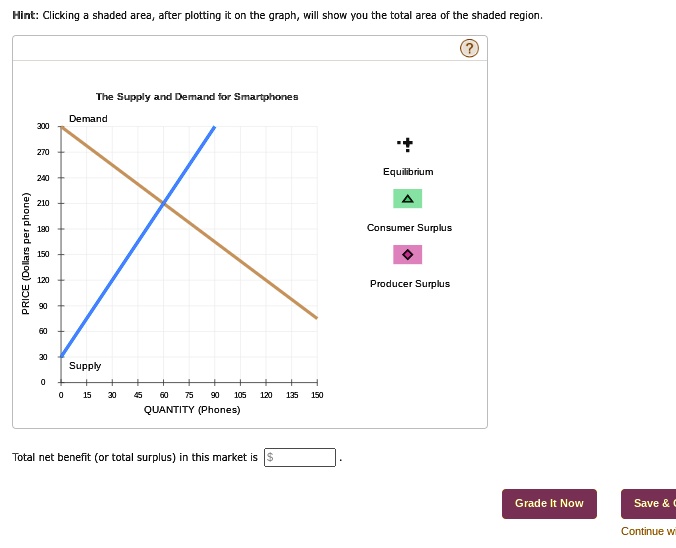
Total net benefit (or total surplus) in this market is Hint: Clicking a shaded area, after plotting it on the graph, will show you the total area of the shaded region.
Equilibrium
Consumer Surplus
Producer Surplus
Total net benefit (or total surplus) in this market is
Continue w
Hint: Clicking a shaded area, after plotting it on the graph, will show you the total area of the shaded region.
?
The Supply and Demand for Smartphones
300
Demand
270
240
Equilibrium
210
180 per 150
Consumer Surplus
D
120 PRICE 90 60
30
Supply
0
15
30
45 60 75 90 105 120 135 150 QUANTITY (Phones)
Total net benefit (or total surplus) in this market is
Grade It Now
Save &
Continue w