Texts: Your comparison of the gross margin percent for Jackels Drugs for the years 2016 through 2019 indicate significant decline. This is shown by the following information. Click the icon to view the data and additional discussion with the controller.
The following additional information is obtained from independent sources and the client's records as a means of investigating the controller's explanations. (Click the icon to view the additional information. Read the requirements.)
CHRD
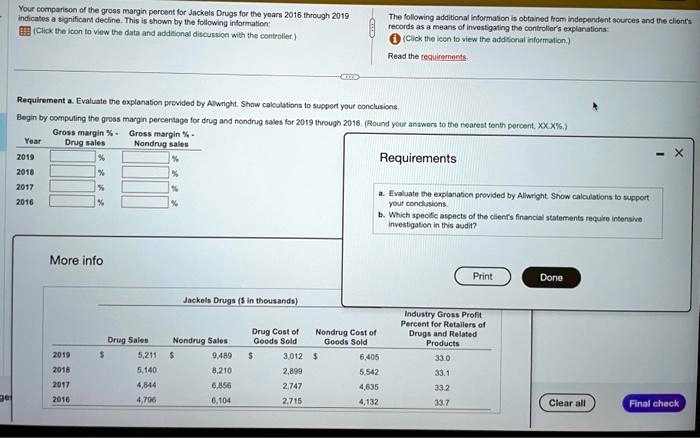
Requirement a: Evaluate the explanation provided by Allwright. Show calculations to support your conclusions. Begin by computing the gross margin percentage for drug and nondrug sales for 2019 through 2016. (Round your answers to the nearest tenth percent.)
Year Drug Sales Nondrug Sales
2019 % %
2018 % %
2017 % %
2016 % %
Requirement b: Which specific aspects of the client's financial statements require intensive investigation in this audit?
X
More info
Print
Done
Jackels Drugs ($ in thousands)
Industry Gross Profit Percent for Retailers of Drugs and Related Products: 33.0 33.1 33.2 33.7
Drug Sales Nondrug Sales
2019: 5,211 9,489
2018: 5,140 8,210
2017: 4,844 6,856
2016: 4,796 6,104
Drug Cost of Goods Sold Nondrug Cost of Goods Sold
2019: 3,012 5,405
2018: 2,899 5,542
2017: 2,747 4,635
2016: 2,715 4,132
Clear all
Final check