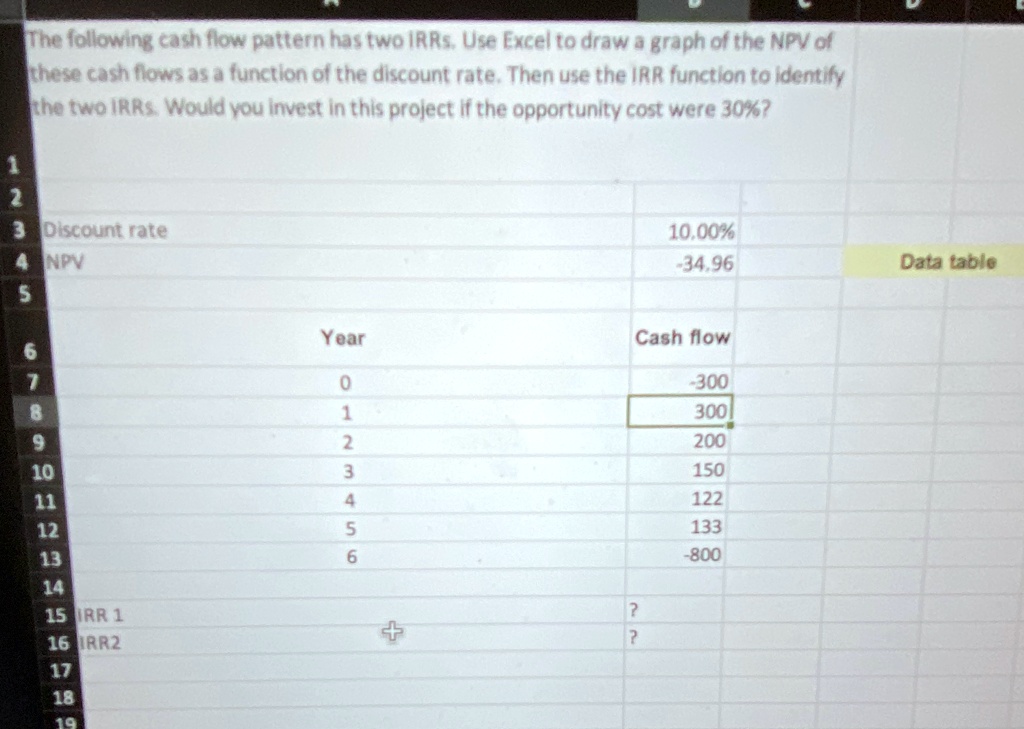
The following cash flow pattern has two IRRs. Use Excel to draw a graph of the NPV of
these cash flows as a function of the discount rate. Then use the IRR function to identify
the two IRRs. Would you invest in this project if the opportunity cost were 30%?
1
2
3 Discount rate
4 NPV
5
10.00%
-34.96
Data table
Year
Cash flow
6
7
0
-300
8
1
300
9
2
200
10
3
150
11
4
122
12
5
133
13
6
-800
14
15 IRR 1
16 IRR2
+
?
?
17
18
19