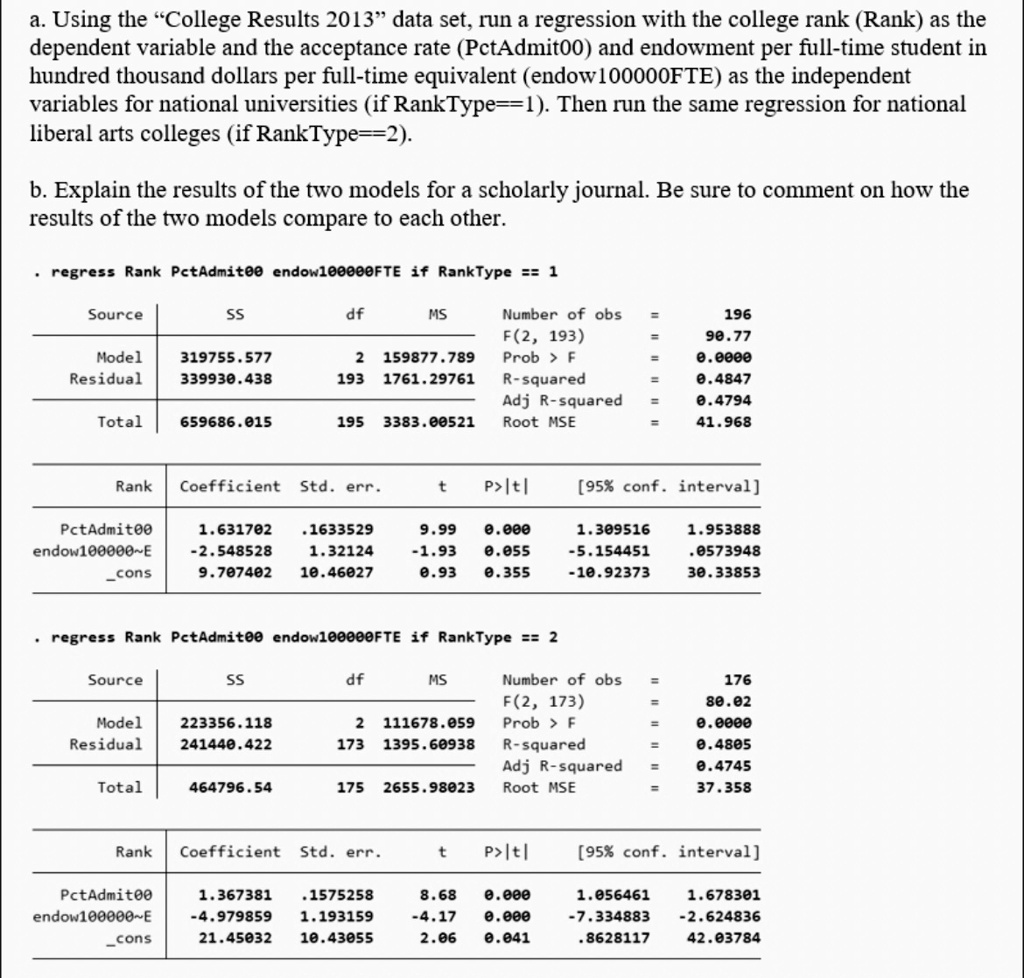
a. Using the "College Results 2013" data set, run a regression with the college rank (Rank) as the dependent variable and the acceptance rate (PctAdmit00) and endowment per full-time student in hundred thousand dollars per full-time equivalent (endow100000FTE) as the independent variables for national universities (if RankType=1).
b. Explain the results of the two models for a scholarly journal. Be sure to comment on how the results of the two models compare to each other.
regress Rank PctAdmit00 endow100000FTE if RankType=1
able[[Source,SS,df,MS],[Model,319755.577,2,159877.789],[Residual,339930.438,193,1761.29761],[Total,659686.015,195,3383.00521]]
able[[Number of obs,=,196],[F(2,193),=,90.77],[Prob > F,=,0.0000],[R-squared,=,0.4847],[Adj R-squared,=,0.4794],[Root MSE,=,41.968]]
able[[Rank,Coefficient,Std. err.,t,P>|t|,[95% conf. interval],],[PctAdmit00,1.631702,.1633529,9.99,0.000,1.309516,1.953888],[endow100000FTE,-2.548528,1.32124,-1.93,0.055,-5.154451,0.0573948],[_cons,9.707402,10.46027,0.93,0.355,-10.92373,30.33853]]
regress Rank PctAdmit00 endow100000FTE if RankType=2
able[[Source,SS,df,MS],[Model,223356.118,2,111678.059],[Residual,241440.422,173,1395.60938],[Total,464796.54,175,2655.98023]]
able[[Number of obs,=,176],[F(2,173),=,80.02, .0000, 0.4805, 0.4745, 37.358]]
able[[Rank,Coefficient,Std. err.,t,P>|t|,[95% conf. interval],],[PctAdmit00,1.367381,1.575258,8.68,0.000,1.056461,1.678301],[endow100000FTE,-4.979859,1.193159,-4.17,0.000,-7.334883,-2.624836],[_cons,21.45032,10.43055,2.06,0.041,.8628117,42.03784]]